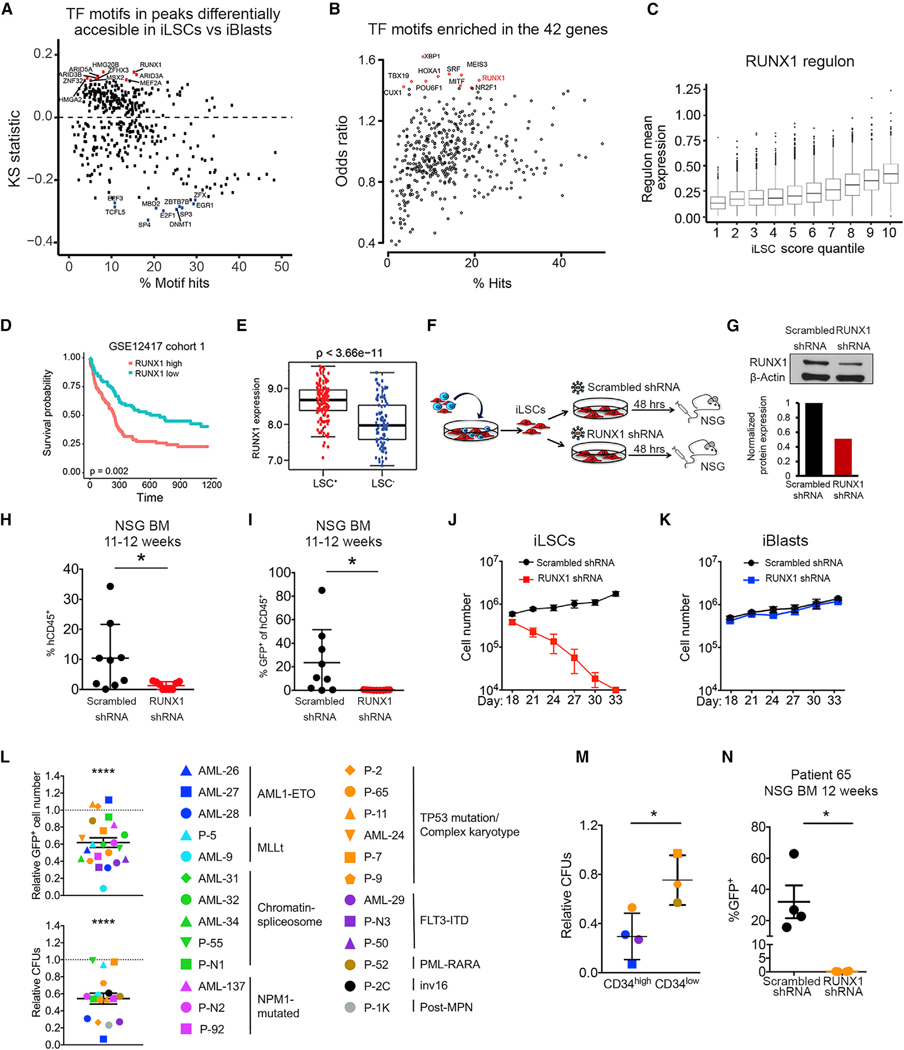
Figure 6. The RUNX1 TF Is Critical for the Maintenance of LSCs.

(A) TF motifs in peaks differentially accessible in iLSC sversus iBlasts.The x axis indicates the percentage of hits for eachTF motif in the atlas. They axis shows the KS statistic, indicating whether peaks containing a specific motif have increased (up) or decreased (down) accessibility log2FC in iLSCs versus iBlasts compared to the background (atlas). The top 10 motifs with increased accessibility in iLSCs are shown in red. The top 10 motifs with increased accessibility in iBlasts are shown in blue.
(B) TF motifs enriched in the 42 genes from Figure 5G, showing RUNX1 as one of the top enriched motifs. The x axis indicates the percentage of hits for each TF motif in peaks associated with the 42 genes. The y axis indicates motif enrichment for the peaks associated with the 42 genes compared to background (atlas), measured as odds ratio. The top 10 more enriched motifs are shown in red.
(C) Correlation of RUNX1 regulon mean expression with iLSC score. Mean regulon expression in single cells grouped in 10 quantiles based on iLSC score (1 corresponds to the quantile with the lowest iLSC score and 10 to the quantile with the highest iLSC score).
(D) Kaplan-Meier estimates of overall survival according to RUNX1 expression, showing that RUNX1 expression is negatively associated with AML patient survival.
(E) RUNX1 expression in LSC+ and LSC− cell fractions from primary AML cells from Ng et al. (2016), showing significantly higher expression in the LSC+ fraction. (F) Separated iLSCs were transduced with a lentiviral vector encoding an shRNA against RUNX1 orscrambled shRNA. At 48 h later, the cells were collected and intravenously injected into sublethally irradiated or busulfan-treated NSG mice.
(G) RUNX1 protein by western Blot in iLSCs transduced with lentiviral vectors encoding RUNX1 or scrambled shRNA 48 h after transduction.
(H) Engraftment levels inthe BM of mice 11–12 weeks after transplantation with iLSCs transduced with RUNX1 orscrambled shRNA. Each data point represents a unique mouse from two independent experiments. Mean and SEM are shown. *p < 0.05, t test.
(I) Assessment of GFP+ cells within the hCD45+ cells engrafted in the BM of mice 11–12 weeks after transplantation with iLSCs transduced with RUNX1 or scrambled shRNA. Each data point represents a unique mouse from two independent transplantation experiments. Mean and SEM are shown. *p < 0.05, t test.
(J) iLSCs were transduced with alentiviral vector encoding RUNX1 orscrambled shRNA.Total cells were counted every 3 days. Mean and SEM of 3 independent experiments are shown.
(K) iBlasts were transduced with a lentiviral vector encoding RUNX1 orscrambled shRNA.Total cells were counted every 3 days. Mean and SEM of 3 independent experiments are shown.
(L) Cell counts of transduced (GFP+) cells (top panel) and colony-forming units (CFUs; bottom panel) of primary AML samples from 9 different AML genetic groups, as indicated in the right, after RUNX1 KD relative to scrambled shRNA transduction. Mean and SEM are shown. ****p < 0.0001, t test.
(M) CFUs of primary AML cells after transduction with RUNX1 shRNA relative to scrambled shRNA stratified in CD34high (%CD34+ > 60%) and CD34low (% CD34+ < 40%). Mean and SEM are shown. *p < 0.05, t test.
(N) GFP+ engraftment of AML patient cells (patient 65) transduced with RUNX1 shRNA or scrambled shRNA in the BM of mice 12 weeks after transplantation. Each data point represents a unique mouse. *p < 0.05, t test. See also Figure S6 and Tables S4 and S5.
