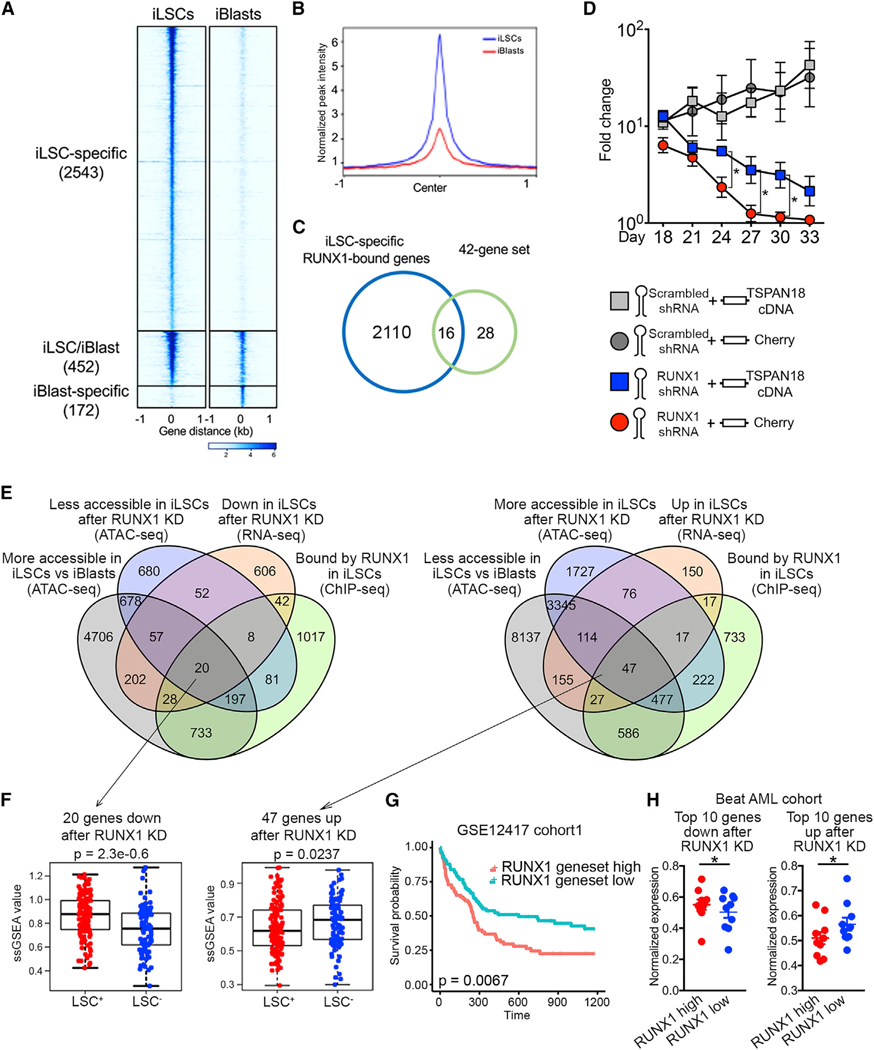
Figure 7. RUNX1-Dependent iLSC Transcriptional Program.

(A) Tornado plot of iLSC-specific, iBlast-specific, and iLSC/iBlast common RUNX1 ChIP-seq peaks. The number of peaks in each group is indicated in parentheses.
(B) iLSC-specific and iBlast-specific metapeaks from the tornado plot shown in (A).
(C) Venn diagram showing the overlap between iLSC-specific RUNX1-bound genes and the 42-gene set from Figure 5G (genes upregulated and more accessible in iLSCs versus iBlasts).
(D) iLSCs were co-transduced with a lentiviral vector encoding RUNX1 shRNA or scrambled shRNA and a lentiviral vector encoding TSPAN18 cDNA or Cherry only and counted every 3 days. Mean and SEM of 4 independent experiments are shown. *p < 0.05, t test.
(E) Left: Venn diagram showing overlap among genes more bound by RUNX1 in iLSCs than iBlasts (ChIP-seq, log2FC > 2), genes downregulated after RUNX1 KD in iLSCs (RNA-seq, adjusted pvalue [padj] < 0.05), genes less accessible after RUNX1 KD in iLSCs (ATAC-seq, padj < 0.05) and genes more accessible in iLSCs than iBlasts (ATAC-seq, padj < 0.05). Right: Venn diagram showing overlap among genes more bound by RUNX1 in iLSCs than iBlasts (ChIP-seq, log2FC > 2), genes upregulated after RUNX1 KD in iLSCs (RNA-seq, padj < 0.05), genes more accessible after RUNX1 KD in iLSCs (ATAC-seq, padj < 0.05), and genes less accessible in iLSCs than iBlasts (ATAC-seq, padj < 0.05).
(F) ssGSEA score of the 20 (down after RUNX1 KD) and 47 (up after RUNX1 KD) genes from E in LSC+ and LSC− fractions from primary AML patient cells from Ng et al. (2016) (GEO: GSE76008), showing significant association with LSC+ status (Wilcoxon rank-sum test).
(G) Kaplan-Meier estimates of overall survival based on the expression of the 20 and 47 genes as ssGSEA score, showing negative association with patient survival.
(H) Expression of the top 10 among the 20 and 47 genes, respectively, activated and repressed by RUNX1, in the Beat AML patient cohort stratified based on RUNX1 expression into RUNX1 high (above average) and RUNX1 low (below average). Min-max-normalized expression values are shown. *p < 0.05, t test. See also Figure S7.
