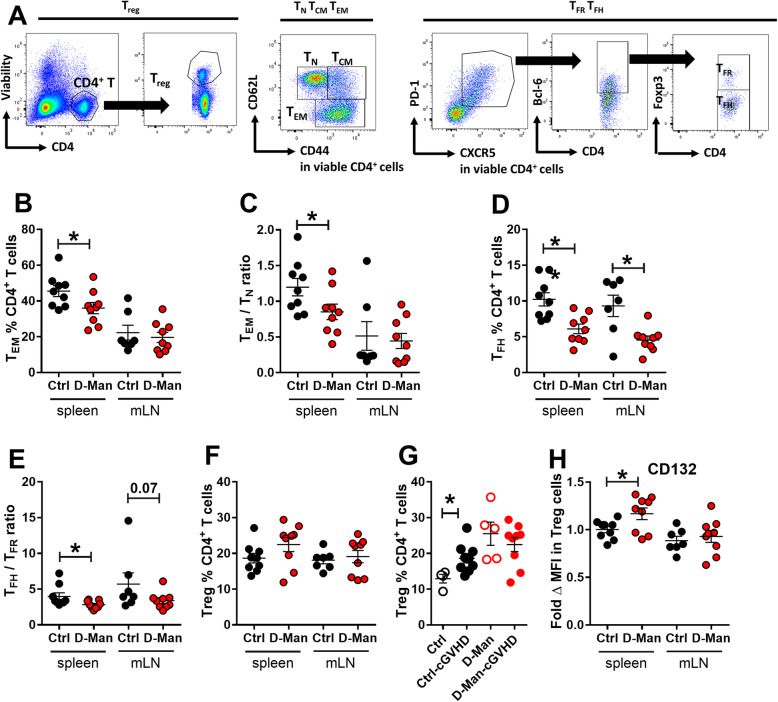
Fig. 4.
D-mannose reduced the expansion of effector CD4+ T cells in the cGVHD model. a. Representative FACS plots of CD4+CD44−CD62L+ TN, CD4+CD44+CD62L− TEM, CD4+PD-1+CXCR5+Bcl-6+Foxp3+ TFR and CD4+PD-1+CXCR5+Bcl-6+Foxp3− TFH cells, and CD4+Foxp3+ Treg cells 3 weeks after cGVHD induction. b. Frequency of TEM cells. c. TEM/TN ratio. d. Frequency of TFH cells. e. TFH/TFR ratio. f. Frequency of Treg cells. g. Comparison of the effect of D-mannose on splenic Treg cell frequency in unmanipulated mice (Ctrl) or cGVHD-induced mice. h. CD132 MFI on Treg cells expressed as fold change relative to the Ctrl group. Mean ± S.E.M of n = 9 per group from 2 to 3 cohorts compared with t tests. *: p < 0.05, **: p < 0.01

