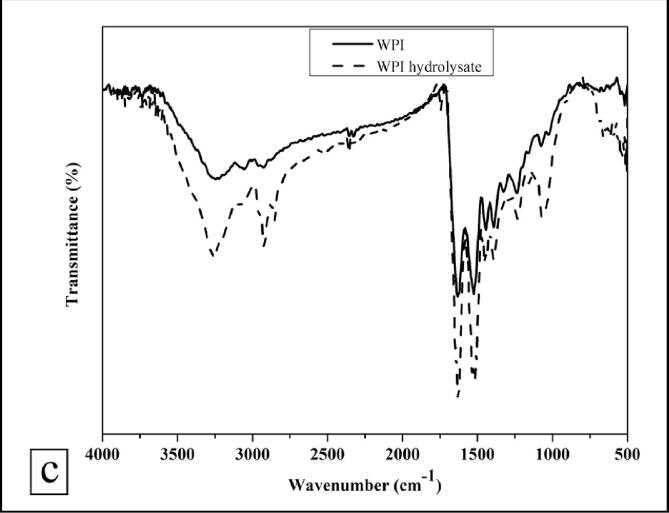
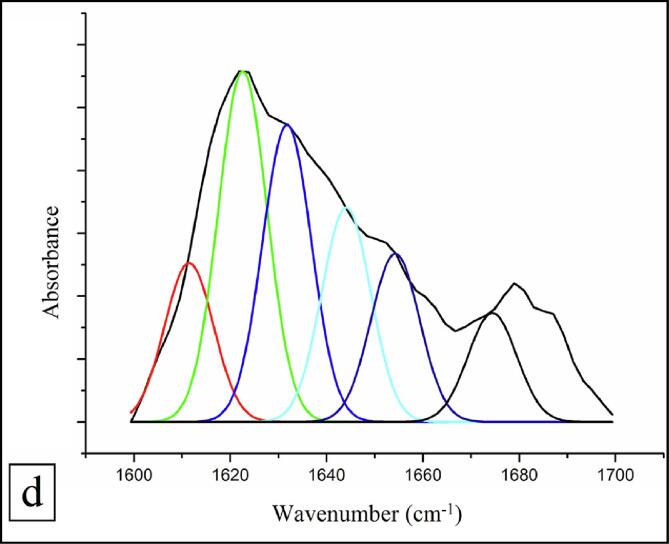
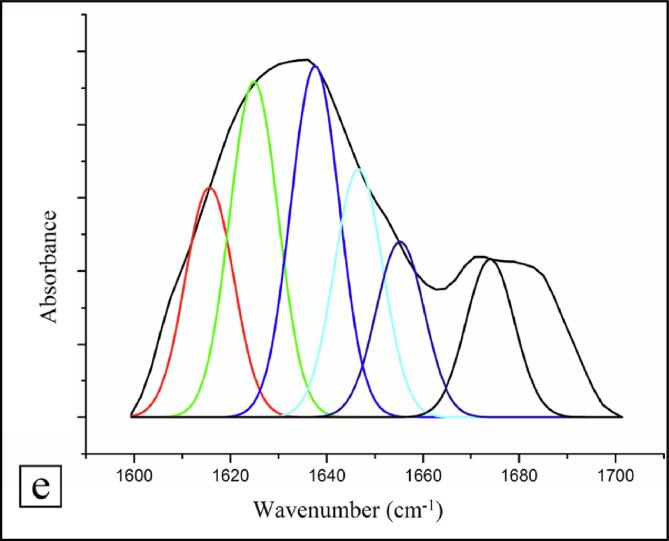
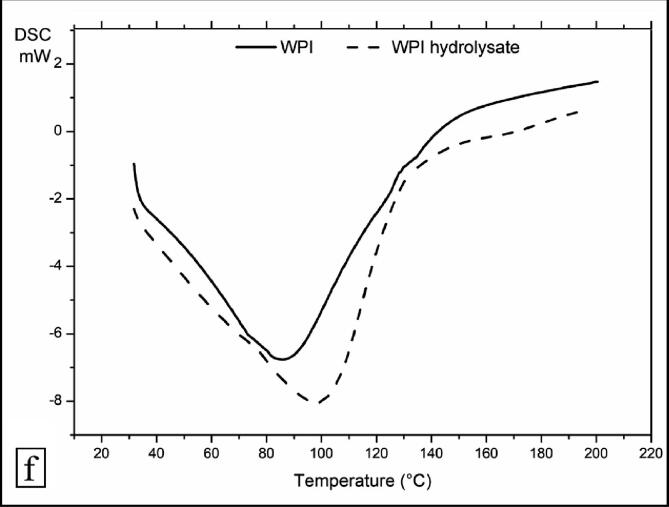
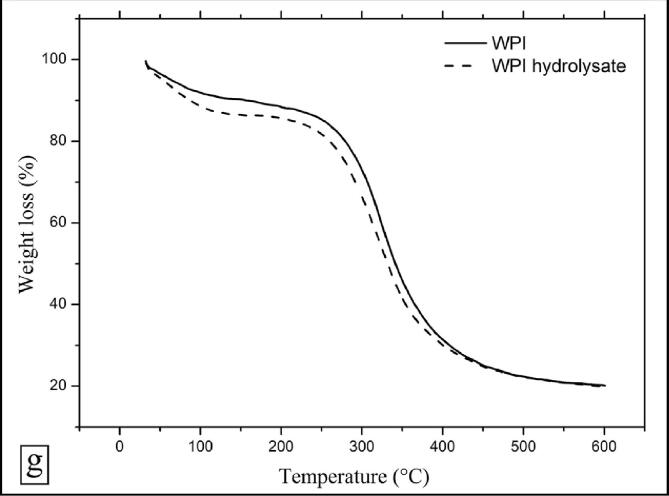
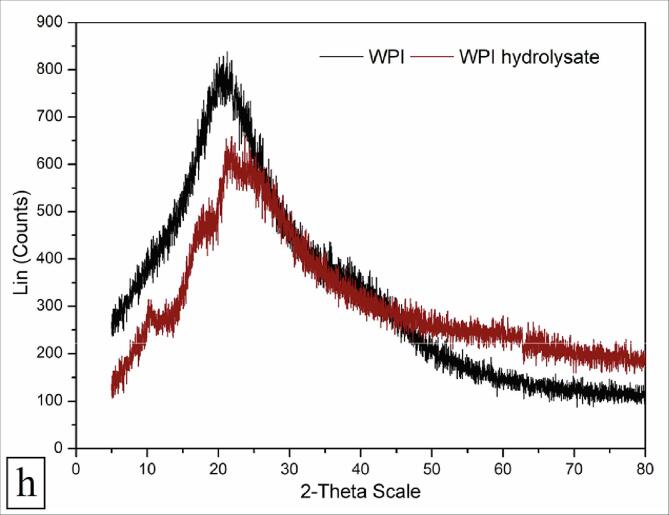
Fig. 4.

(a). SDS-PAGE profile of WPI and WPI hydrolysate [Lane A: standard molecular weight markers, Lane B: WPI hydrolysate, and Lane C: WPI]; (b) UV–Vis spectra of WPI and WPI hydrolysate; (c) FTIR spectra of WPI and WPI hydrolysate; secondary structure analysis of (d) WPI and (e) WPI hydrolysate as determined by Gaussian multi-component fitting [The secondary structure fractions: β-antiparallel (red colour), β-strands (green colour), β-sheets (blue colour), random coils (cyan colour), α-helices (navy blue colour) and β-turns (black colour)]; (f) DSC profile of WPI and WPI hydrolysate; (g) TGA profile of WPI and WPI hydrolysate; and (h) XRD profile of WPI and WPI hydrolysate. (For interpretation of the references to colour in this figure legend, the reader is referred to the web version of this article.)


