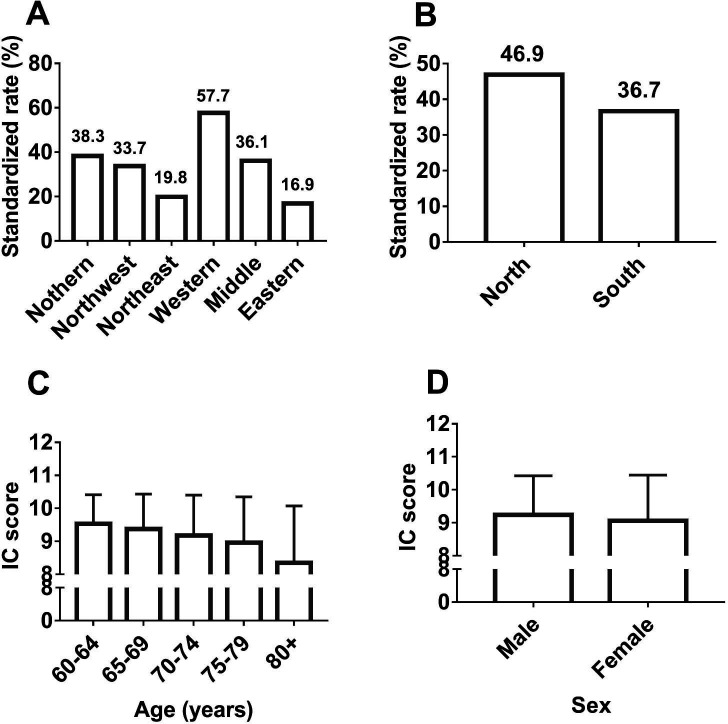
Figure 1.
Intrinsic capacity in different regions, age and sex groups. (A) The comparison of the weighted prevalence of IC decline among the six regions of China (χ2 test, p<0.01). (B) The comparison of the weighted prevalence of IC decline between north China and south China (χ2 test, p<0.01). (C) The comparison of the IC score among different age groups (one-way ANOVA, p<0.01). (D) The comparison of the IC score between men and women (t-test, p<0.01). ANOVA, analysis of variance; IC, intrinsic capacity.

