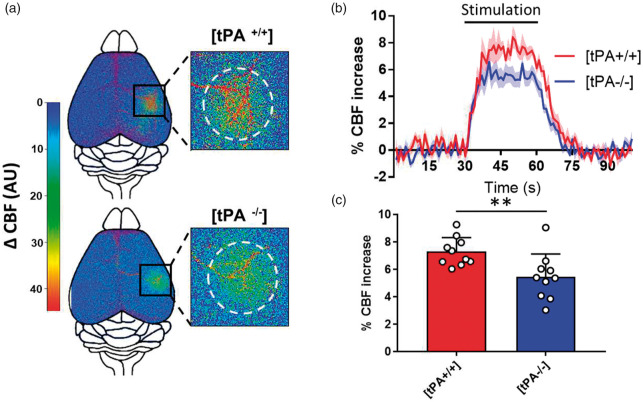
Figure 1.
Functional hyperemia is reduced in tPA−/− mice. (a) Pseudo colored representative subtraction maps of the CBF highlighting CBF change during whiskers stimulation of tPA WT and tPA−/− mice. Maps were obtained by subtracting Laser Doppler speckle images recorded during stimulation to images recorded during rest. Color intensity goes from blue (no change during stimulation) to red (strong CBF increase during stimulation). (b) Mean CBF signal traces from the S1bf during whiskers stimulation of tPA WT ( ) and tPA−/− (
 ) mice extracted from Laser Doppler speckle images (curves in transparency define the SEM, n = 10 per group). (c) Quantification of the CBF increase during whiskers stimulation in tPA WT and tPA−/− mice. Circles represent values for each mouse (Mean ± SD, Mann–Whitney test, n = 10 per group).

