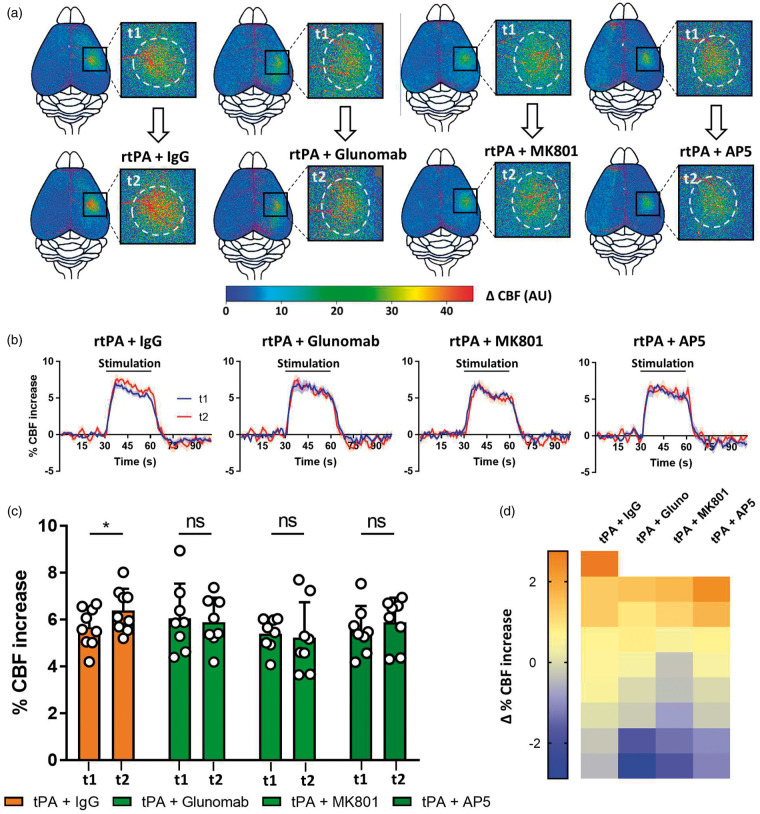
Figure 6.
Inhibition of the interaction between vascular rtPA and NMDARs prevents the rtPA-induced potentiation of functional hyperemia. (a) Pseudo colored representative subtraction maps of the CBF highlighting CBF change during whiskers stimulation of tPA−/− mice before and after the injection of rtPA (10 mg/kg) and a control IgG (5 mg/kg), rtPA (10 mg/kg) and Glunomab® (5 mg/kg), rtPA (10 mg/kg) and MK-801 (0.4 mg/kg), or rtPA (10 mg/kg) and AP5 (0.4 mg/kg). Color intensity goes from blue (no change during stimulations) to red (strong CBF increase during stimulation). (b) Mean CBF signal trace from the S1bf during whiskers stimulation of tPA−/− mice before ( ) and after (
 ) the injection of rtPA (10 mg/kg) and a control IgG (5 mg/kg), rtPA (10 mg/kg) and Glunomab® (5 mg/kg), rtPA (10 mg/kg) and MK-801 (0.4 mg/kg), or rtPA (10 mg/kg) and AP5 (0.4 mg/kg) extracted from Laser Doppler speckle images (curves in transparency define the SEM, n = 8–10 per group). (c) Quantification of the CBF increase during whiskers stimulation in tPA−/− mice before (t1) and after (t2) IV injection of rtPA (10 mg/kg) and a control IgG (5 mg/kg), rtPA (10 mg/kg) and Glunomab® (5 mg/kg), rtPA (10 mg/kg) and MK-801 (0.4 mg/kg), or rtPA (10 mg/kg) and AP5 (0.4 mg/kg). Circles represent values for each mouse (Mean ± SD, Wilcoxon test, n = 8–10 per group). (d) Diagram showing the evolution (delta) of the hemodynamic response of each mouse between the control condition and after the IV injection of rtPA (10 mg/kg) and a control IgG (5 mg/kg), rtPA (10 mg/kg) and Glunomab® (5 mg/kg), rtPA (10 mg/kg) and MK-801 (0.4 mg/kg), or rtPA (10 mg/kg) and AP5 (0.4 mg/kg).

