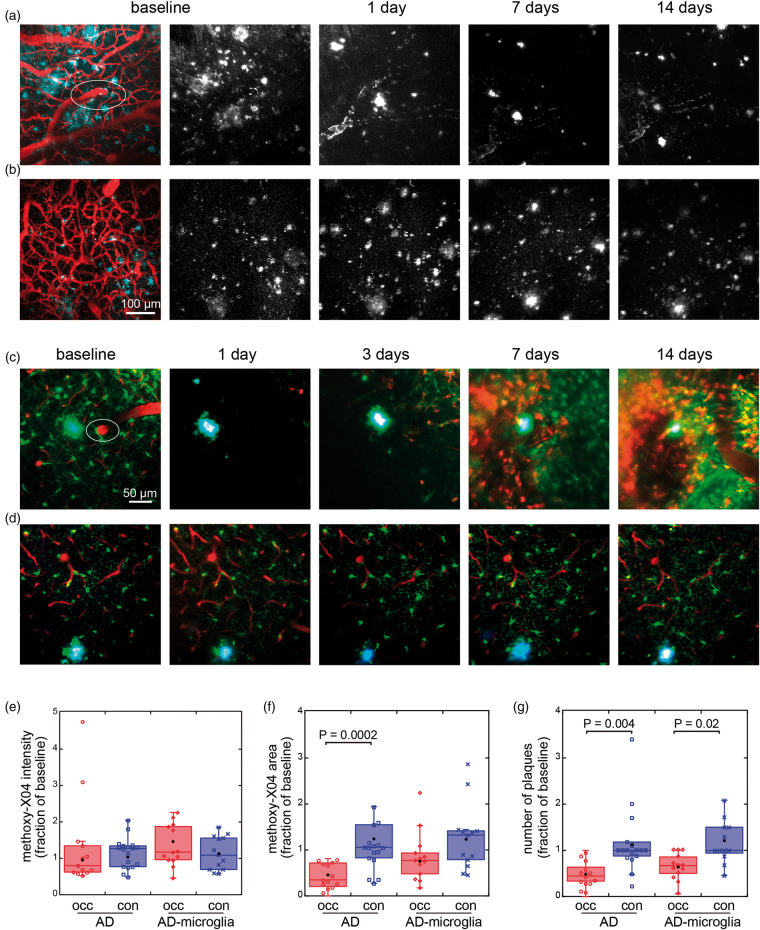
Figure 3.
In vivo imaging of plaque and microglia dynamics after an ischemic lesion induced by rose bengal photothrombosis of a penetrating arteriole. (a) Plaques in an APP/PS1 animal are visualized with methoxy-X04 (cyan and white) and vessels by Texas-red dextran injection (red). White ellipse indicates targeted penetrating arteriole. (b) Control region imaged in animal with no lesions. Images in (a) and (b) are maximum projections displayed with median filtering. (c) Penetrating arteriole occlusion in an AD-microglia mouse. Microglia (Cx3cr1-GFP) are shown in green, blood vessels in red, and methoxy-X04 in cyan. (d) Contralateral side of the same mouse was imaged as control. The images in (c) and (d) are average projections of 20 µm. Contrast of each channel was adjusted for best view in the baseline images. The contrasts of images from the subsequent days are displayed so that the mean of manually chosen background regions appears the same across days. (e) Mean intensity and (f) area of methoxy-X04 labeling, and (g) number of plaques at one day after lesion (occ) and in control (con) in the image region with values all normalized to baseline in APP/PS1 (occlusion: 13 lesions in 13 animals, 8 males and 5 females, controls: 10 males and 7 females, 8–12 months old) and AD-microglia mice (13 lesions in 13 animals, 5 males and 8 females, 8–10 months old). (f) Outliers not shown on graph (AD, control: 5.9, 8.21). (g) Outliers not shown on graph (AD, control: 3.4, 4.6). Data were plotted so that each dot represents one animal. Black dots show means. p values calculated from Wilcoxon–Mann–Whitney rank-sum test. AD: Alzheimer’s disease.

