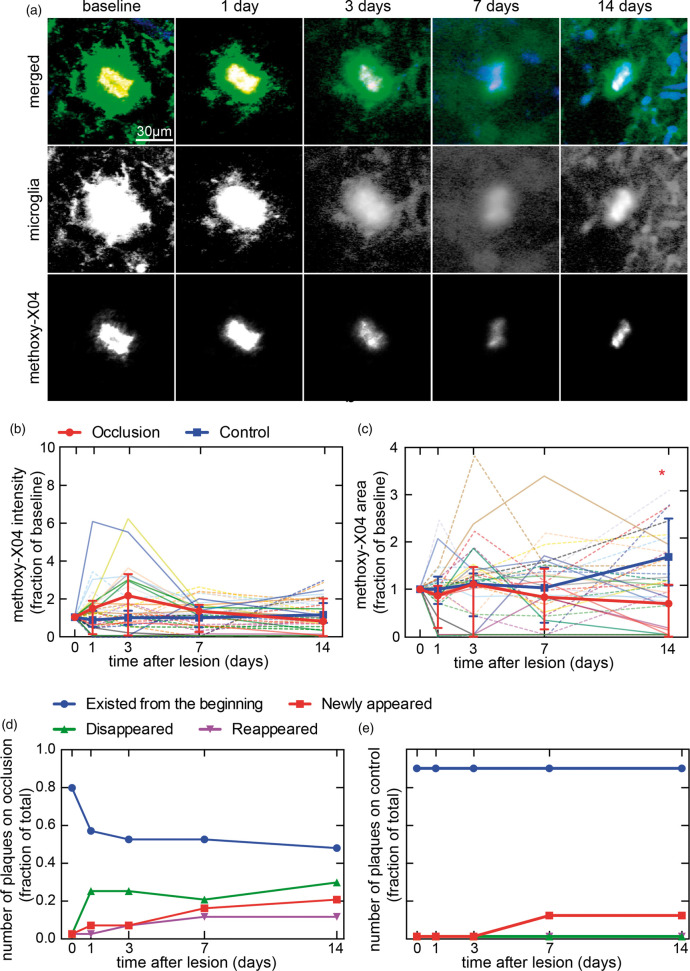
Figure 4.
Two-photon microscopy images of plaques and microglia, and quantification of individually identified plaques after a penetrating arteriole occlusion. (a) An example plaque near penetrating arteriole occlusion. Microglia (Cx3cr1-GFP in green), plaques (methoxy-X04 in red), and blood vessels (Texas-red in blue) in AD-microglia mice after occlusion of a penetrating arteriole. Methoxy-X04 deposits overlapped spatially with GFP-labeled microglia, so show up as yellow in the merged images. Images were median filtered with radius of one pixel and are summed projections of the log of intensities. (b) Intensity and (c) area of methoxy-X04 in individually identified plaques that were tracked over 14 days after a penetrating arteriole occlusion in AD-microglia mice (three lesions in three animals, two males and one female, 8–10 months old). Individual plaques from occlusion sites are represented by dim solid lines and plaques from control sites on the contralateral hemisphere of the same animals are plotted with dim dotted lines. Bold lines show medians with error bars representing interquartile ranges. Kruskal Wallis test shows no significant differences across the 14-day period in intensity, but significant differences in area (p = 0.0024), which was followed by multiple comparison analyses with Dunn’s correction (*occlusion day 1 vs. occlusion day 14: p = 0.0028, occlusion day 14 vs. control day 14: p = 0.0005). In (b) and (c) plaques that disappeared were shown in the graph as having an intensity and area of zero. (d) Number of individually tracked plaques near the occlusion and (e) in control regions. Numbers are normalized by the cumulative number of plaques present during the two weeks.

