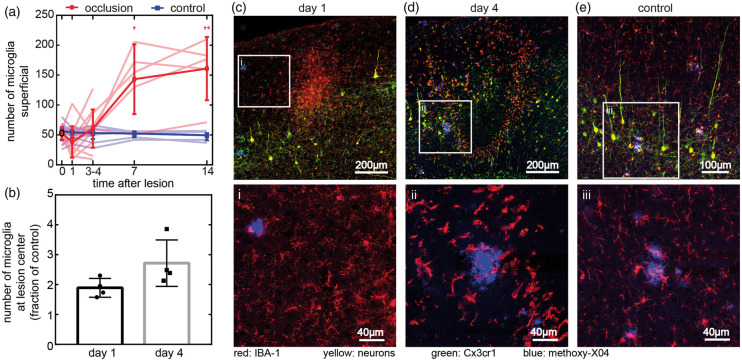
Figure 6.
Microglia after a penetrating arteriole occlusion. (a) Quantification of microglia number from in vivo images at lesions in a 350 × 350 × 20 µm volume near the cortical surface and in control sites on the contralateral hemisphere. Bold line shows mean and standard deviation. A subset of animals was harvested at four days and used for immunohistology, but data are shown pooled for all animals measured at each time point (n = 5 animals imaged for 14 days, three males and two females, 8–12 months old; n = 7 animals imaged for four days, four males and three females, 8–12 months old). Dim lines represent individual animals. Paired t-tests were used to compare experiment and control groups on the same day (*p = 0.03, **p = 0.01). (b) Microglia counted in a 500 × 500 µm square at lesion center in 20-µm tissue sections one and four days after lesion normalized to contralateral side (mean and standard deviation). Each dot represents one animal (n = 8 animals, day 1: one male and three females; day 4: two males and two females, 8–12 months old). (c–e) Representative images of sections one (c) and four days (d) after lesion. Microglia were visualized by both anti-IBA-1 antibody (red) and Cx3cr1-GFP (green), neurons express YFP (yellow), and plaques were stained by methoxy-X04 (blue). (e) Representative control image was taken from the contralateral hemisphere four days after lesioning. Images of contralateral hemisphere from one day after lesion shown in Supplementary Figure 9. White square regions show representative high magnification images (i–iii) from (c–e) with just methoxy-X04 and anti-IBA-1 shown for clarity.

