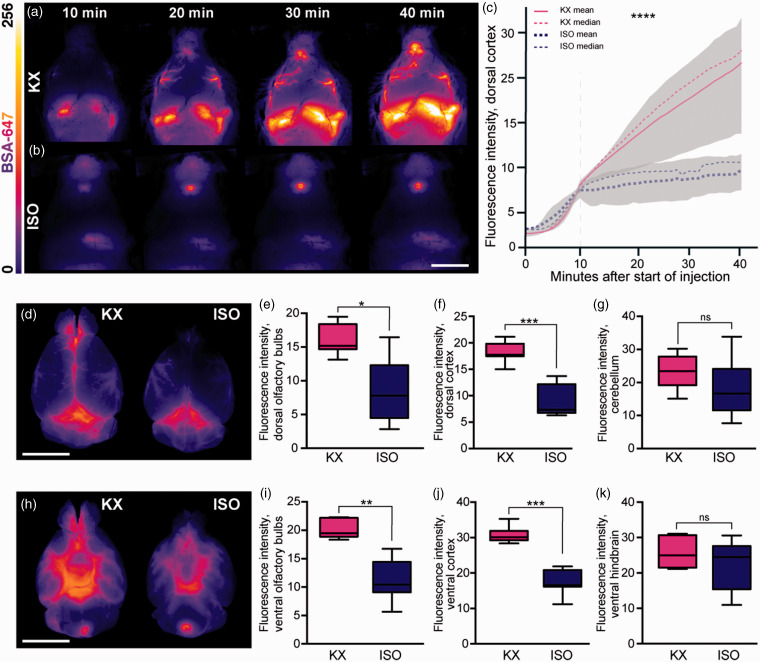
Figure 1.
CSF tracer influx is robust both in vivo and ex vivo in KX anaesthesia. Representative images of whole-brain dorsal view in vivo 10, 20, 30 and 40 min after CM injection under (a) KX-anaesthesia and (b) ISO-anaesthesia. (c) Mean tracer intensity in vivo across dorsal cortical surface in KX- and ISO-anaesthesia groups from start of injection of AlexaFluor647-conjugated bovine serum albumin (BSA-647) in the cisterna magna. Plotted lines represent mean and median, greyed areas represent interquartile range (25–75%). Grey dashed vertical line represents when CM injection ended. N = 5 for both KX and ISO. (d) Representative images of whole-brain dorsal surface in KX- and ISO-anaesthetised mice. The intensity of the CSF tracer in (e) dorsal surface of olfactory bulbs, dorsal (f) cortex, and (g) cerebellum. (h) Representative images of the ventral surface of whole brain in KX- and ISO-anaesthetised mice. The intensity of tracer in ISO compared to KX-anaesthetised mice in (i) olfactory bulbs, (j) cortex, and (k) ventral hindbrain. N=7 for both KX and ISO. *p < 0.05, **p < 0.01, ***p < 0.001, ****p < 0.0001 with Mann–Whitney U Test for pair-wise comparisons and two-way ANOVA for time-lapse data. Scale bars = 6 mm. Box plots represent minimum, first quartile, median, third quartile, and max values.

