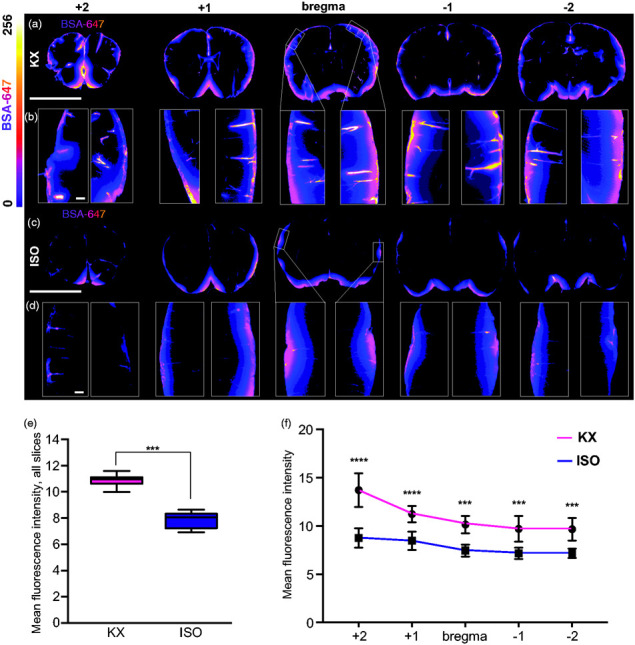
Figure 2.

KX increases CSF tracer penetration. (a) Representative images of coronal brain slices KX-anaesthetised mice at 5 different locations (+2, +1, 0, −1, −2 mm from bregma) injected with AlexaFluor647-conjugated bovine serum albumin (BSA-647). (b) Magnified view of CSF tracer penetration into cortex at five locations (+2, +1, 0, −1, −2 mm from bregma) from each hemisphere. (c) Representation of coronal brain slices from ISO-anaesthetised mice at five different locations (+2, +1, 0, −1, −2 mm from bregma). (d) Magnified view of CSF tracer penetration into cortex at five locations (+2, +1, 0, −1, −2 mm from bregma) from each hemisphere. (e) Quantification of BSA-647 CSF tracer influx in KX- and ISO-anaesthetized brains, averaged across all five brain slices collected, showing less influx in ISO-anaesthetised mice. Mann–Whitney U Test. (f) Differences in slice tracer intensity by region (+2, +1, 0, −1, −2 mm from bregma). The fluorescence intensity of the CSF tracer was lower in ISO- mice compared to KX-anaesthetised mice across all positions relative to bregma. N = 7 for both KX and ISO. ***p < 0.001 with two-way ANOVA, Sidak’s multiple comparison test. Scale bars = 4 mm and 100 µm for whole-brain slices and insets, respectively. Box plots represent minimum, first quartile, median, third quartile, and max values. XY plot represents mean ± SD.
