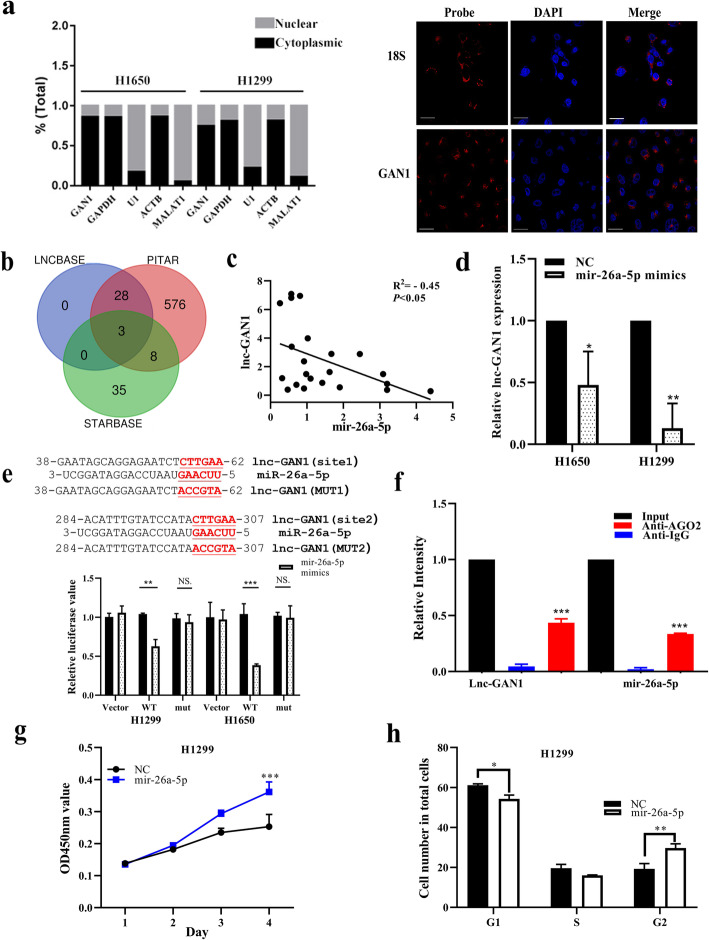
Fig. 5.
Lnc-GAN1 located in cytoplasm sponges and inhibits miR-26a-5p. a Left-Panel: Lnc-GAN1 is mainly located in the cytoplasm of H1299 and H1650 cells, as measured by real-time qPCR on cytoplasm and nucleus, respectively. GAPDH mRNA was used as a cytoplasmic control, while U1 snRNA was used as a nuclear control. Right-Panel: lnc-GAN1 was visually observed in the cytoplasm of H460 cells, as shown by FISH. 18S was used as the positive control in cytoplasm. b Venn diagram shows 3 shared predicted targets (miRNAs) of lnc-GAN1 by three databases, including miR-26a-5p, mir-26b-5p and mir-1297. c There is a significantly negative correlation between lnc-GAN1 and mir-26a-5p levels in 30 NSCLC samples, as determined by qRT-PCR (R2= − 0.45, P < 0.05). d Ectopic miR-26a-5p expression significantly reduced lnc-GAN1 mRNA levels in H1299 and H1650 cells (* P < 0.05), as measured by qRT-PCR. e Upper-Panel: The predicted wild-type seed sequences of lnc-GAN1 complementary with miR-26a-5p and investigator-designed mutated seed sequences. Lower-panel: Histogram shows that when miR-26a-5p was overexpressed in H1299 or H1650 cells, the luciferase activity of cells with wild-type seed sequence of lnc-GAN1 was sharply reduced compared with that of control cells, but not changed in cells with mutant miR-26a-5p binding sites, as assayed by Dual-luciferase reporter assays, indicating that there are direct binding sites between lnc-GAN1 and miR-26a-5p. f RIP was performed on H1650 cell lysates with mouse anti-AGO2 or IgG. The precipitated lnc-GAN1 and miR-26a-5p were evaluated by real-time qRT-PCR, and both lnc-GAN1 and miR-26a-5p were enriched in the same precipitation by anti-AGO2 (*** P < 0.001). g Overexpressed miR-26a-5p promoted proliferation of H1299 cells, as shown by CCK8 assay. h Overexpressed miR-26a-5p accelerated cell cycle progression in H1299 cells. Data represent the mean ± SD of three independent experiments

