Fig. 5.
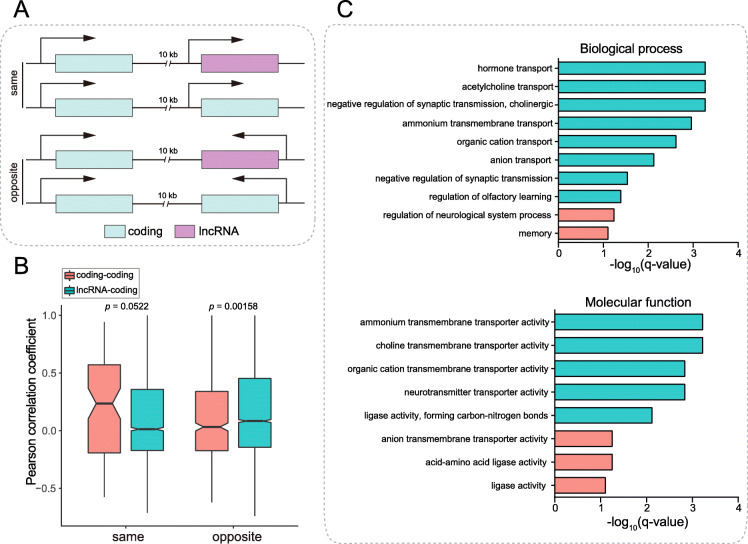
Correlation of the expression levels of lncRNAs with neighbouring protein-coding genes. a Schematic diagram of lncRNA/coding and neighbouring coding genes within a 10 kb distance. The upper panel shows the lncRNA-coding and coding-coding GPs with the same transcription direction (same-direction group), and the lower panel represents GPs with opposite transcription directions (opposite-direction group). b Box plot showing the distribution of the PCCs of coding-coding and lncRNA-coding GPs with the same or opposite transcription directions. c GO enrichment results for coding genes overlapping with neighbouring lncRNAs located on opposite strands for biological processes (top) and molecular functions (bottom). GO enrichment analysis was performed using the clusterProfiler package. Enriched GO terms with q-values < 0.05 were defined as statistically significant. Orange indicates significantly enriched GO terms, while blue indicates GO terms that were weakly or not enriched

