Fig. 4.
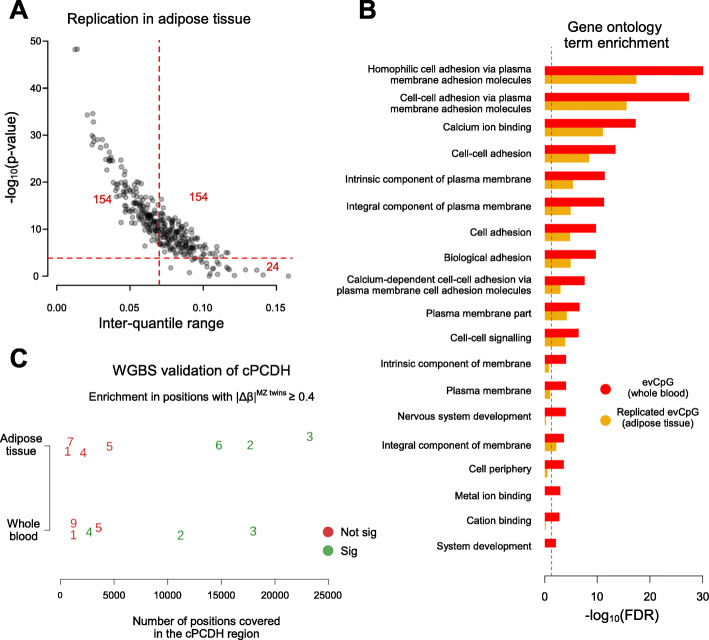
evCpG variation in other tissues. a Replication on 332 out of 333 evCpGs in adipose tissue. –log10(equivalence p value) is plotted against IQR. Threshold lines represent IQR filter of 0.07 and Bonferroni significance. Numbers in red highlight the number of hits in a given sector. b Gene ontology (GO) term enrichment of evCpGs (red) and the replicated subset in adipose tissue (orange). The threshold line indicates false discovery rate of 0.05. c Whole genome bisulfite sequencing validation on epigenetic discordance between MZ twins in the cPCDH region using data of the TwinsUK cohort. Here, we observe the dependence between significance and coverage in the cPCDH region. Twin pairs 1 to 5 were assayed in both tissues. For twin pair 8 in whole blood, no sites were shared between twins and hence, enrichment could not be performed. Twin pairs are highlighted in green when a significant enrichment in |Δβ| ≥ 0.4 on the cPCDH loci with respect to the background is observed.

