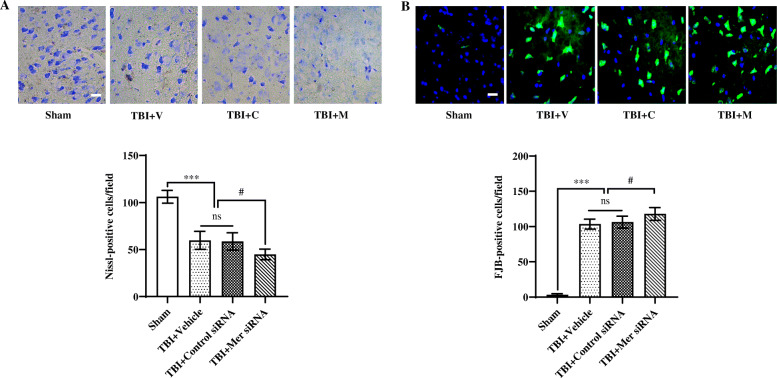
Fig. 5.
Inhibition of Mer aggravated neuronal damage and degeneration following TBI. a Representative images of Nissl staining in the ipsilateral cortex from the sham, TBI + vehicle (TBI + V), TBI + control siRNA (TBI + C), and TBI + Mer siRNA (TBI + M) groups, respectively. Quantification analysis showing TBI caused a significant decrease in the number of Nissl-positive cells in the ipsilateral cortex at 3 days post-TBI, and Mer siRNA application further decreased the number of Nissl-positive cells in the injured cortex after TBI. n = 6 mice per group. Scale bar = 20 μm. b Representative images of Fluoro-Jade B (FJB) staining in the ipsilateral cortex from the sham, TBI + V, TBI + C, and TBI + M groups, respectively. Quantification analysis showing TBI caused a significant increase in the number of FJB-positive cells in the ipsilateral cortex at 3 days post-TBI, and Mer siRNA application further increased the number of FJB-positive cells in the injured cortex after TBI. n = 6 mice per group. Scale bar = 15 μm. In a, b, data are presented as mean ± SD; #, p < 0.05; ***, p < 0.001; ns, nonsignificant, p > 0.05. One-way ANOVA followed by Bonferroni’s post hoc tests

