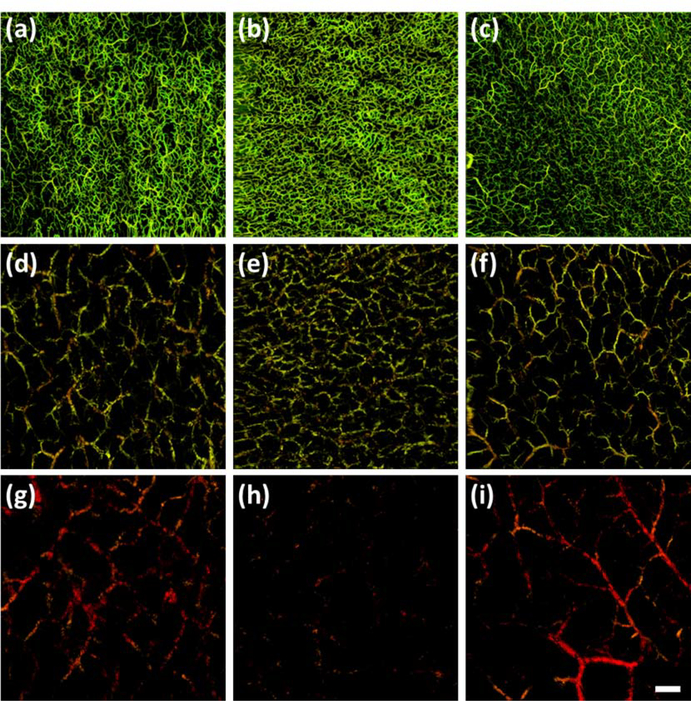
Figure 11:
Optical coherence tomography angiography (OCTA) of the same wound presented in figure 10 segmented into vascular slabs of 0 – 200 μm, 200 – 500 μm, and 500 – 1000 μm below the dermal/epidermal boundary of the skin. Such depths are thought to represent the papillary dermis, the upper reticular dermis, and the reticular dermis, respectively. (a) – (c) En face OCTA images of the superficial vessels of the papillary dermis (0 – 200 μm below the dermal/epidermal boundary), correlating with images (a) – (c) shown in figure 10. Visible here are vessel density changes corresponding with wound boundaries, (a) and (c), and an augmented vessel density within the wound center, (b). (d) – (f) En face OCTA images of the upper reticular dermis (200 – 500 μm below the dermal/epidermal boundary), correlating with (a) – (c) above, respectively. Visible again are vessel density changes between all three regions of interest. (g) – (i) En face OCTA images of the reticular dermis (500 – 1000 μm below the dermal/epidermal boundary), correlating with (a) – (c) above, respectively. Vascular parameters differ between all three regions of interest again. Scale bar represents 1 mm.

