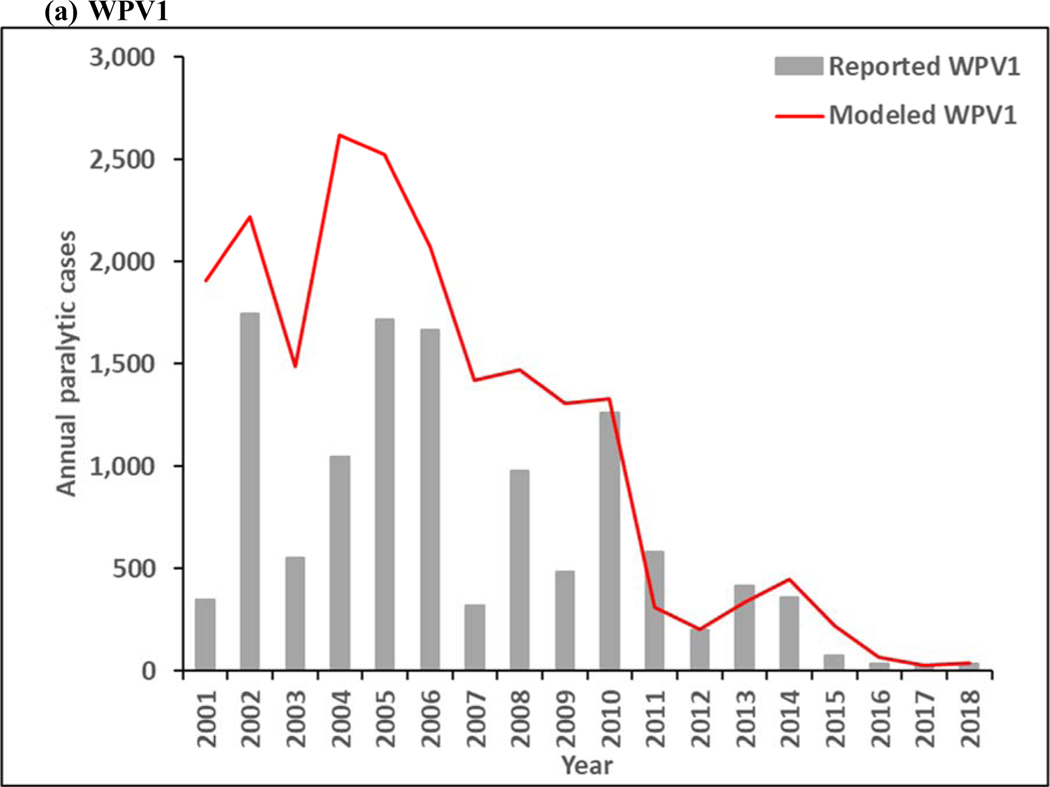
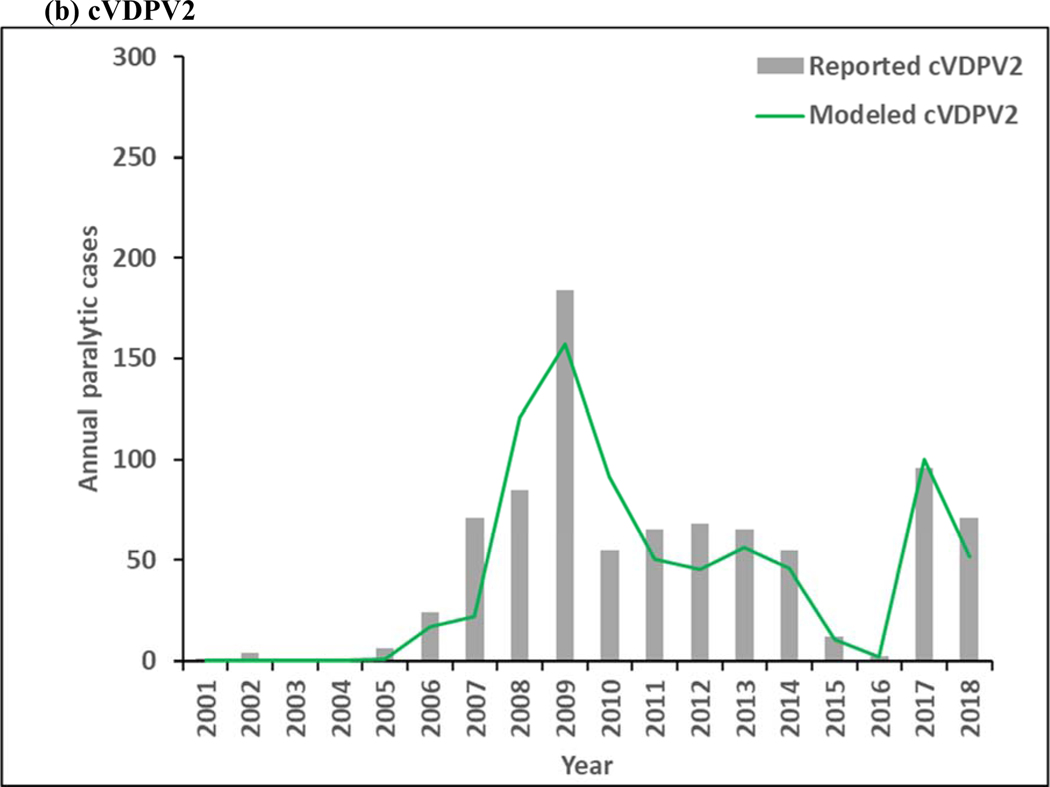
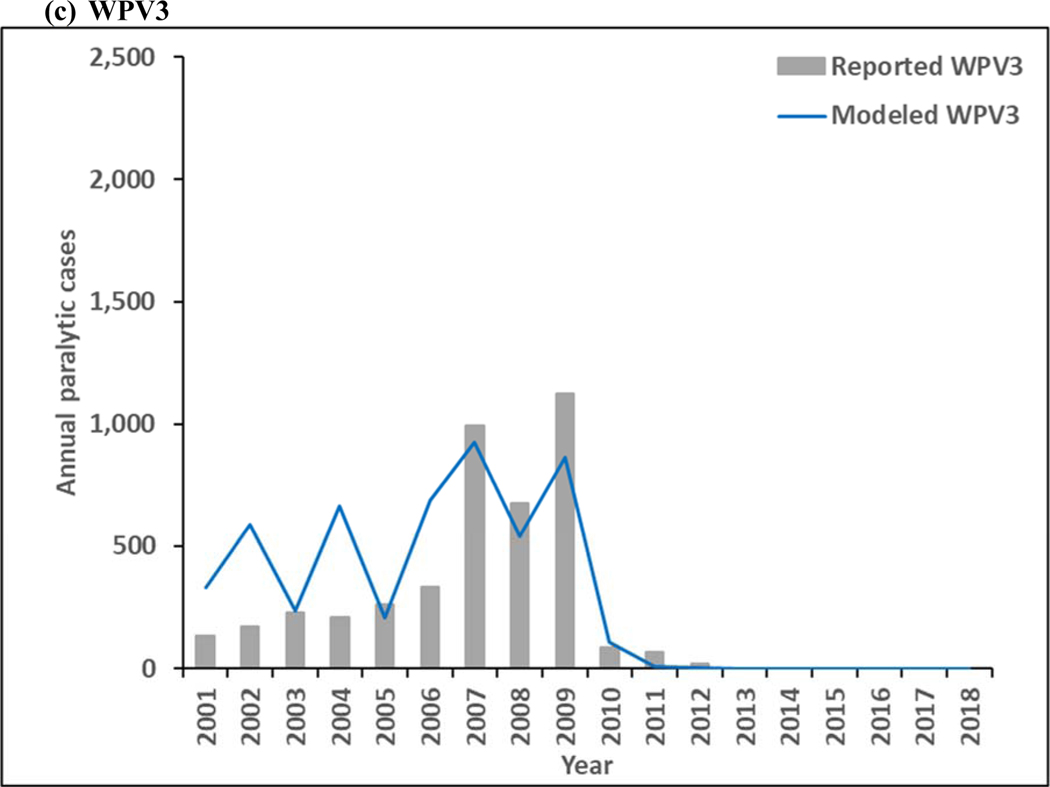
Figure 3:
Modeled annual poliovirus incidence 2001–2018 by serotype compared to reported cases for (a) serotype 1 wild poliovirus (WPV1), (b) serotype 2 circulating vaccine-derived poliovirus (cVDPV2), and (c) serotype 3 wild poliovirus (WPV3)
Note: Excludes reported cVDPV1 cases that occurred in year (number): 2001 (12), 2002 (12), 2005 (2), 2007 (1), 2008 (4), 2011 (2), 2014 (1), 2015 (20), 2016 (3), and 2018 (27).
Note: Excludes reported cVDPV3 cases that occurred in year (number): 2005 (1), 2006 (1), 2009 (1), 2010 (5), 2012 (3), 2013 (1), and 2018 (7).


