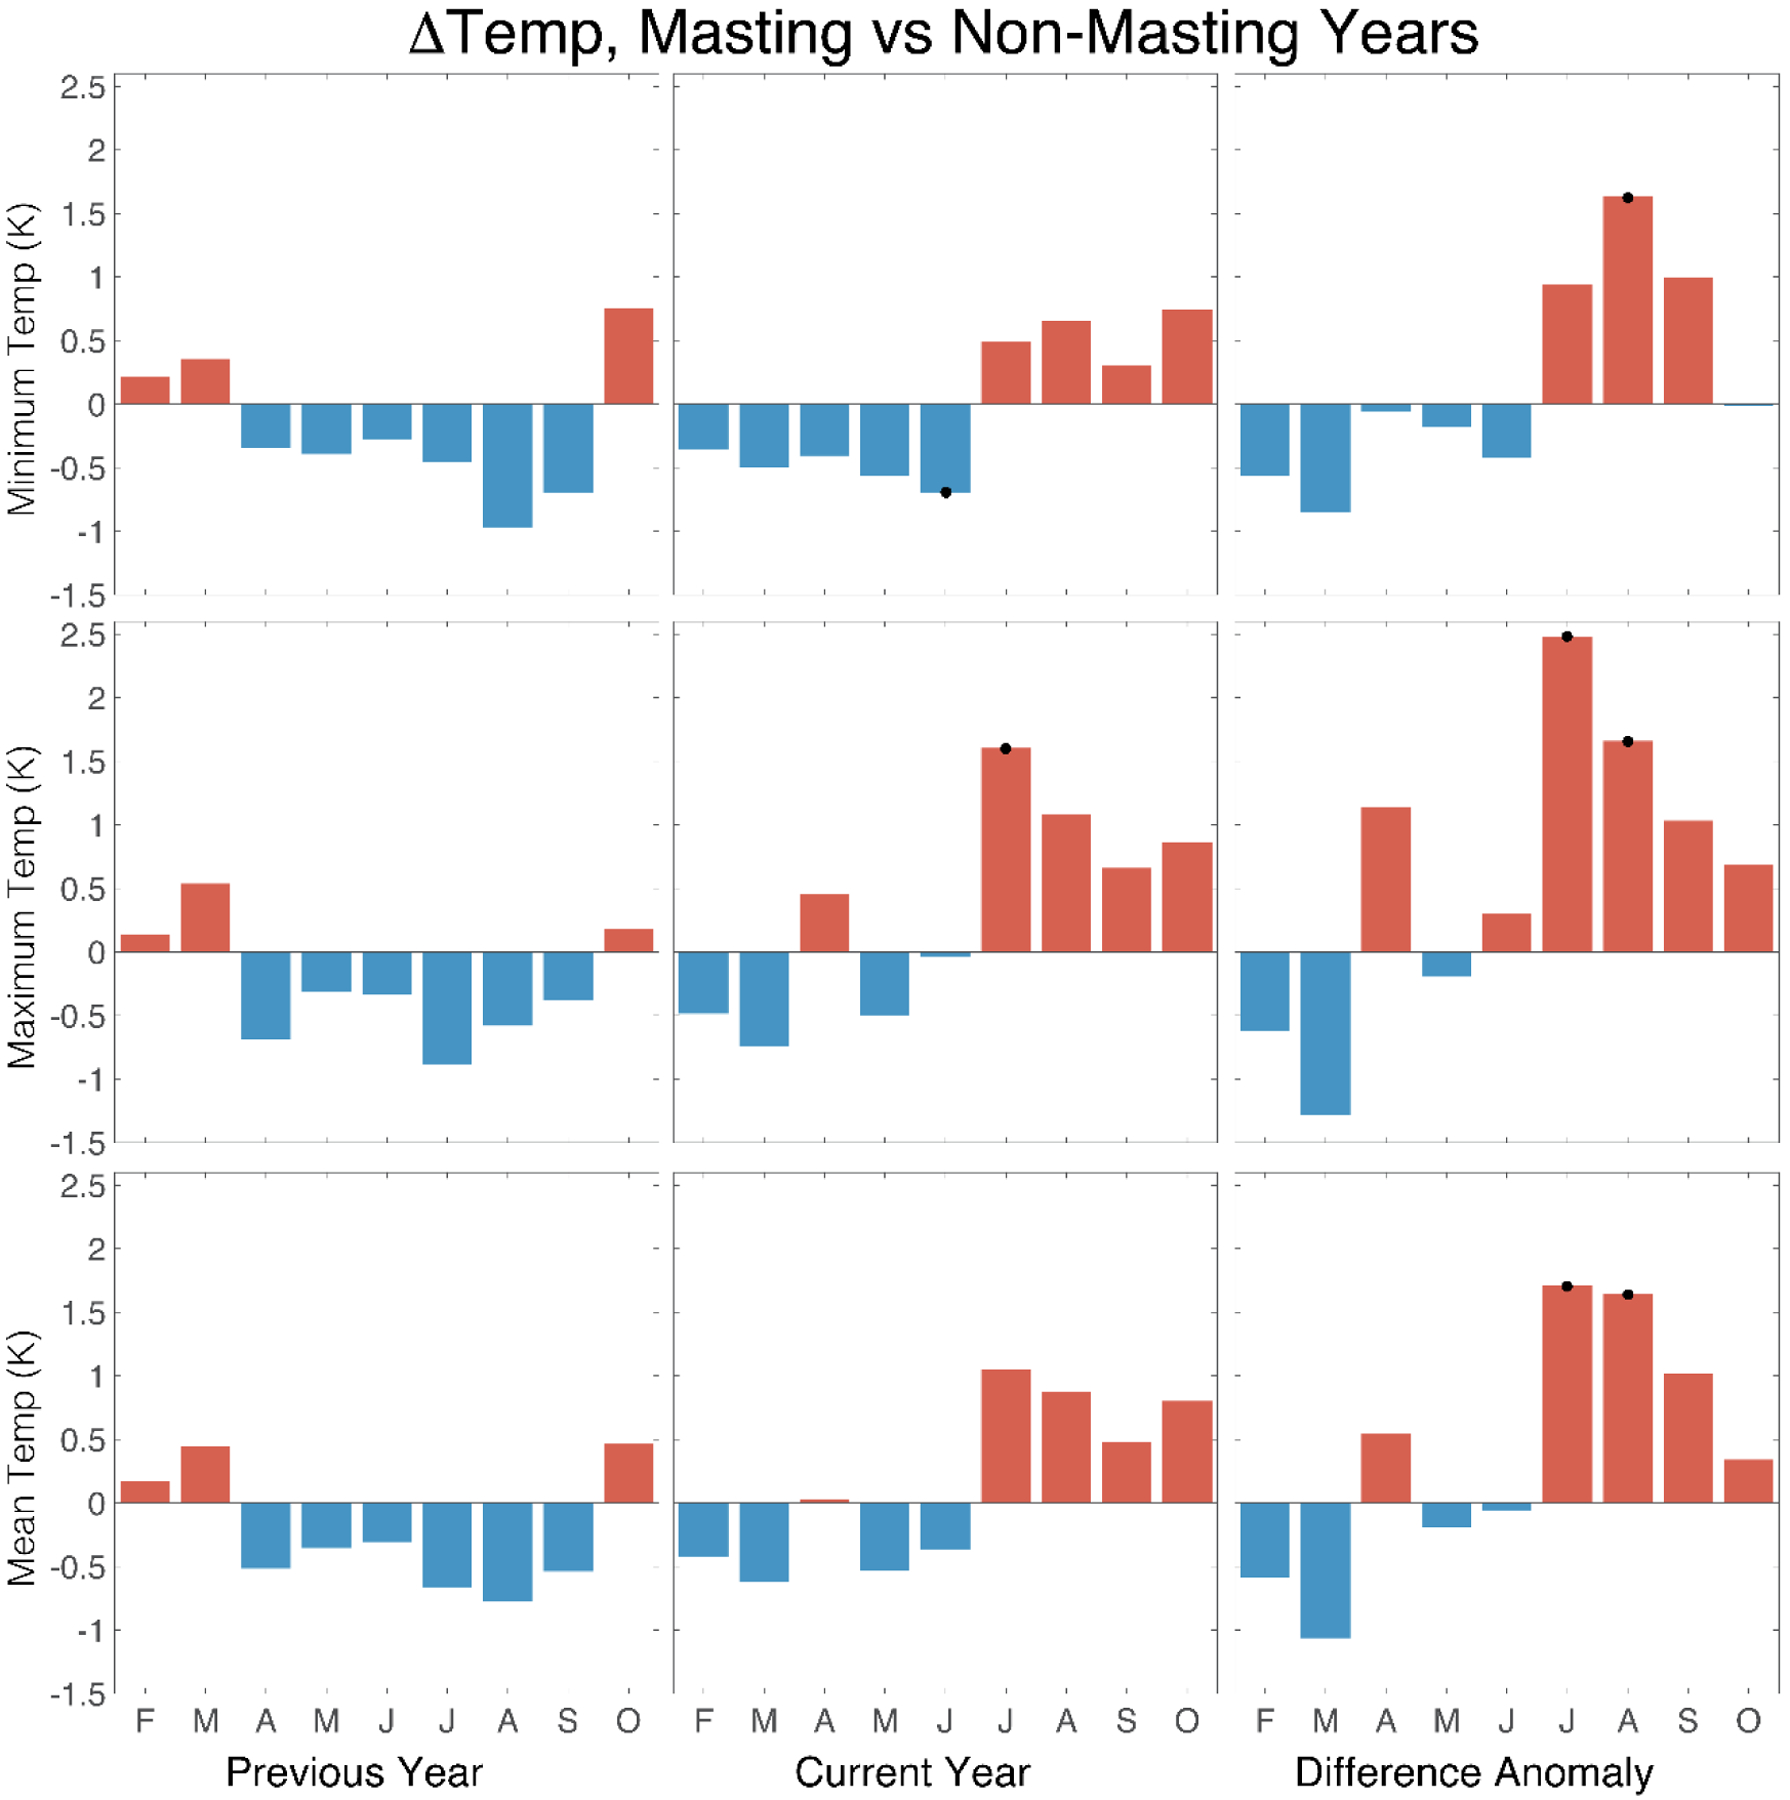
Figure 2.

Monthly minimum, maximum, and mean temperature anomalies (significance assessed with a two-sided Student’ t-test and indicated by black (P <0.05) dots) associated with mast and non-years for a population of Quercus robur trees growing in Southampton, southern England. Results are shown for years prior to the mast year (left column); the mast year (centre column); the difference between the two (right column).
