
Extended Data Fig. 1 |. Extended characterization of oncogenic tissue architecture models.
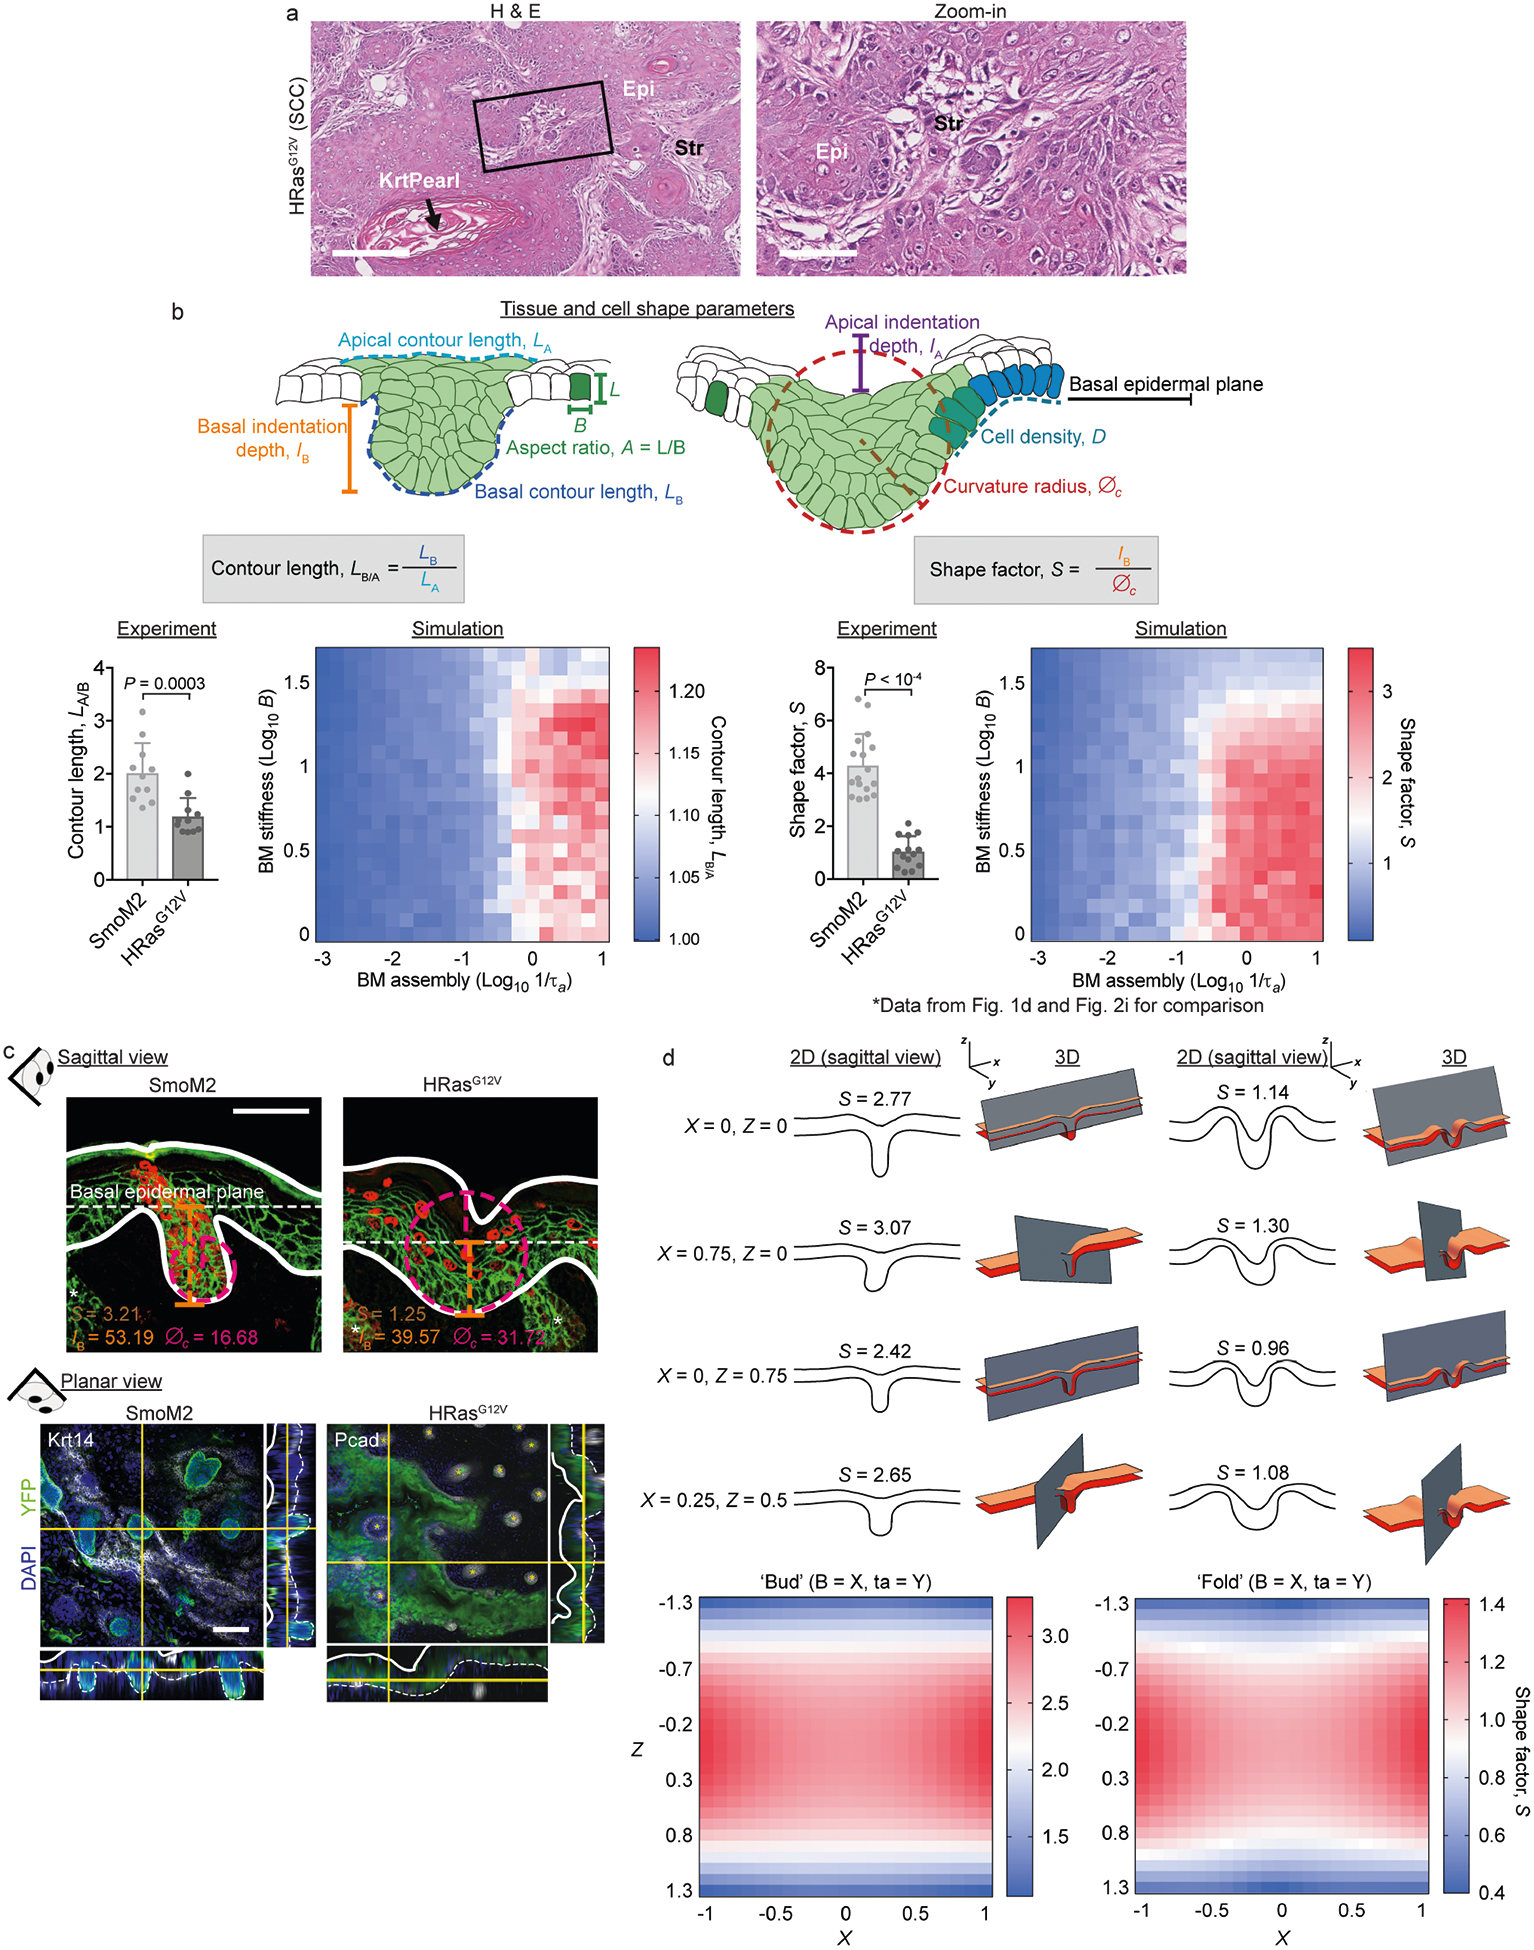
a, Characterization of adult SCCs. E9.5 oncogenic embryos were infected in utero with LV–Cre to selectively transduce single-layered embryonic epidermis. Tissues were harvested at three months (HRasG12V SCCs) and stained with haematoxylin and eosin (H & E). Epi, epithelium; Krt pearl, keratin pearl, a hallmark of SCCs; Str, stroma. Scale bars: left, 250 μm; right (zoom-in), 100 μm. b, Extended description of premalignant architectures and parameters used to quantify them. The schematics at the top show all parameters used here to quantify tissue and cell-shape parameters, including apical indentation depth (IA), basal indentation depth (IB), apical contour length (LA), basal contour length (LB), curvature radius (∅c), cell density (D) and cell aspect ratio (A). Bottom, quantification of S values (data repeated from Fig. 1d, 2i and contour length (LB/A; SmoM2, n = 11; HRasG12V, n = 11; mean + s.d.; Mann–Whitney U-test) for lesions from four embryos, two litters for each condition. We compare experimental measurements and simulation results (see Supplementary Note 1 for modelling details), which show strong agreement. However, we note that S is better able than LB/A to discriminate SmoM2 and HRasG12V phenotypes. c, Sagittal sections and whole-mount (planar) views show the distinct tissue shapes of SmoM2 and HRasG12V lesions. Measurements of IB and ∅c, from which S are calculated, are depicted on example images (sagittal view). d, Two-dimensional (2D) and 3D simulations of tissue shapes. Archetypal budded and folded tissue architectures were simulated in 3D and cut into 2D planes with varying cutting angles X and Z (see Supplementary Note 4 for details). The resultant tissues and their calculated S values are shown. Note that both architectures are equally well discerned without systematic bias (see the range of S values). Scale bars, 50 μm.