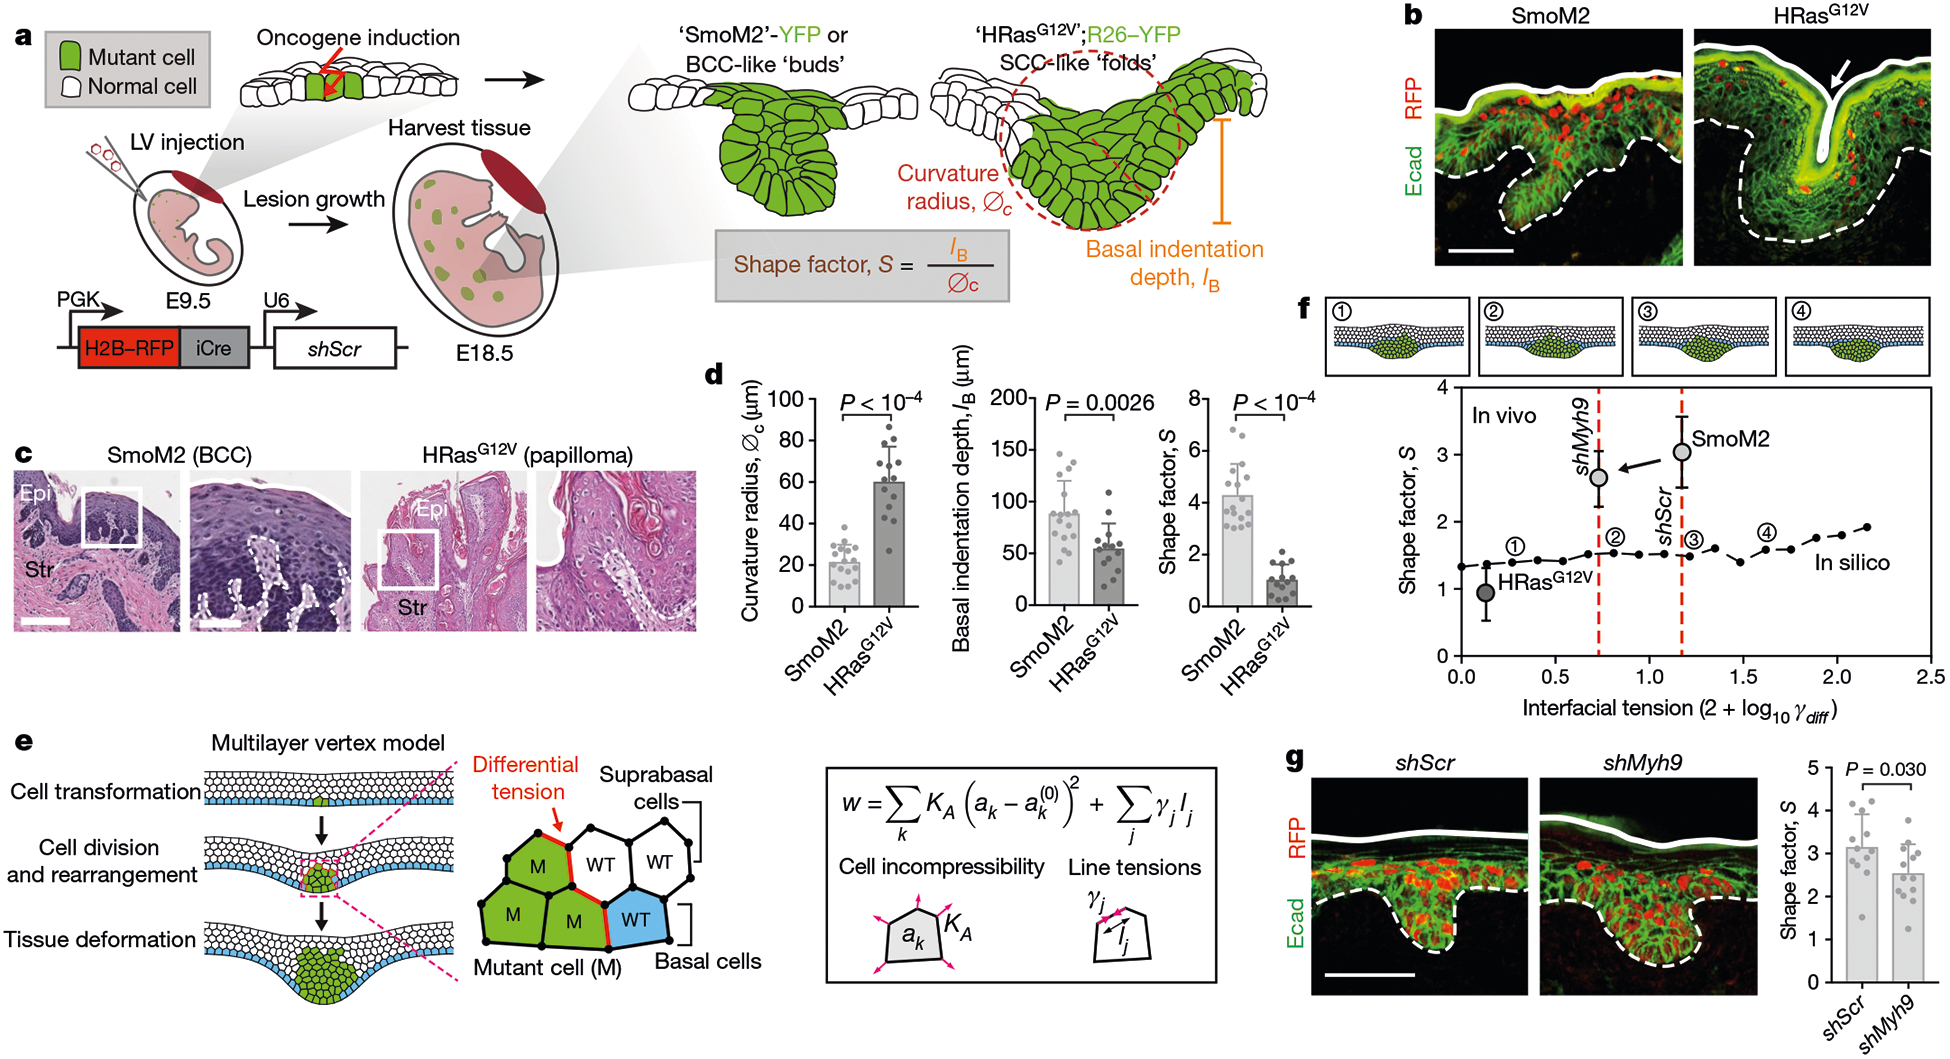
Fig. 1 |. Multilayer in vivo and in silico models of early tumour morphogenesis.

a, Mouse models of oncogenesis. SmoM2 or HRasG12V embryos at E9.5 were transduced in utero with LV–Cre; at E18.5, tissues were harvested and tumour architectures were analysed for the indicated parameters. The lentiviral vector is shown at the bottom left. iCre, improved Cre recombinase; PGK, phosphoglycerate kinase. b, Immunofluorescence images of oncogenic growths. Dotted lines, epithelial–stromal borders; solid lines, apical borders; arrow, apical fold; Ecad, E-cadherin. Scale bar, 50 μm. c, Histology of adult mouse tumours from these mice. Epi, epithelium; Str, stroma. Scale bars: left, 250 μm; right (zoom-in), 100 μm. d, Quantifications of lesions (SmoM2, n = 17; HRasG12V, n = 14) from four embryos (taken from two litters) per condition (means + s.d., two-tailed unpaired t-test). This experiment was independently repeated twice. e, Multilayer epithelium vertex model. A single basal cell is transformed (green) and then undergoes cycles of division. Differential line tensions at interfaces between mutant (M) and wild-type (WT) cells simulate interfacial tensions. Forces are contributed by cell area incompressibility (KA) and apical, basal and lateral line tensions (γj); effective energy (w) is minimized (k refers to an individual cell; j is the cell edge; and ak is the cross-sectional area). See Supplementary Note 1 for details. f, Bottom, effects of varying interfacial tensions (γdiff) on tumour architecture. S values (median, from n = 5 independent simulations) from in silico modelling are plotted as a black line. Example snapshots for the indicated values of γl are shown at the top. Experimental data from d, g (for shMyh9, SmoM2 and HRasG12V; mean ± s.d.) are overlaid. g, Left, immunofluorescence images of SmoM2 embryos transduced with LV–Cre containing either scrambled hairpin control (shScr) or Myh9-targeted shRNA (shMyh9). Scale bar, 50 μm. Right, lesion shape factors (shScr, n = 12; SmoM2, shMyh9, n = 13; mean + s.d., two-tailed unpaired t-test) from four embryos, two litters per condition.
