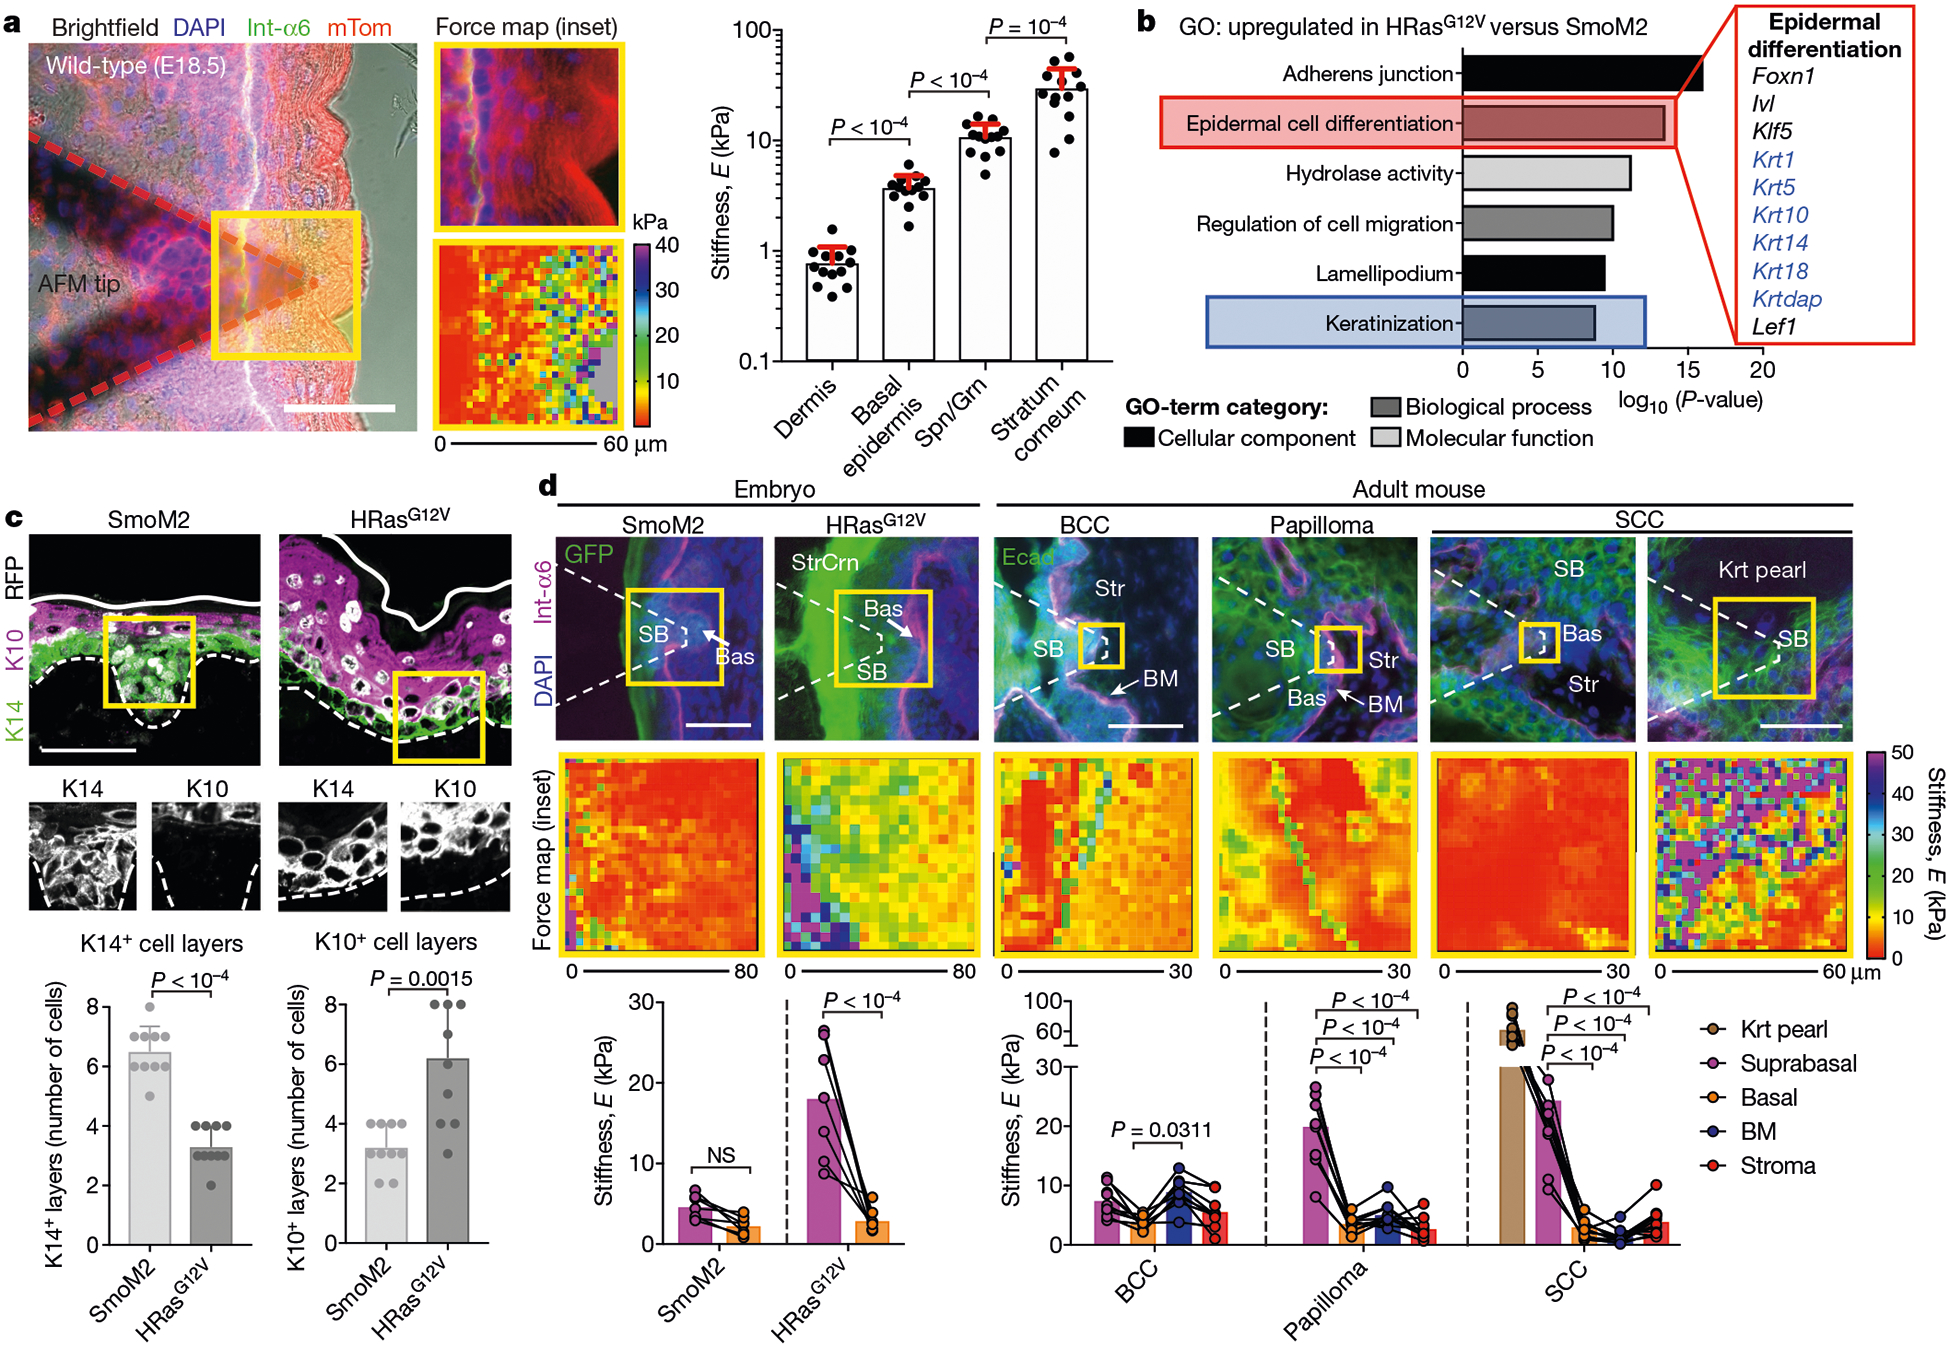
Fig. 3 |. Tumour-specific subrabasal stiffness gradients.

a, Left, fluorescence image of fresh E18.5 skin overlaid with an AFM tip, probed for spatially resolved stiffness measurements. DAPI stains nucleic acid; Int-a6 encodes integrin α6 and marks epithelial–stromal borders; mTom (mTomato) stains plasma membranes. Centre, force maps of the yellow-boxed region. Right, stiffness values for layers of stratified skin (dermis, basal epidermis, spinous and granular suprabasal layers (Spn/Grn), and stratum corneum; n = 13 regions from four embryos; mean + s.d.; Holm–Sidak’s multiple comparisons test). b, Top GO terms for mRNAs upregulated by twofold or more in HRasG12V versus SmoM2 progenitors, from n = 3 independent biological replicates. Keratins are shown in blue. Statistical significance was determined by unpaired two-tailed t-test and P-values were corrected using the Benjamini–Hochberg method. c, Top, immunofluorescence images of keratin 14 (K14)+ and keratin 10 (K10)+ expression, and bottom, their quantifications (means + s.d.) for SmoM2 (n = 11) and HRasG12V (n = 11) lesions from three embryos each. d, AFM stiffness maps of oncogenic embryonic and adult SmoM2- and HRasG12V-driven lesions. Suprabasal (SB), basal (Bas), BM, keratin pearl (Krt pearl) and stroma (Str) tumour regions are indicated. Paired measurements of each tumour region for SmoM2 (n = 7), HRasG12V (n = 7), BCCs (n = 9), papillomas (n = 9) and SCCs (n = 9) lesions/tumours are shown (means; two-way ANOVA with Bonferroni’s multiple comparisons test; NS, not significant). Scale bars, 50 μm.
