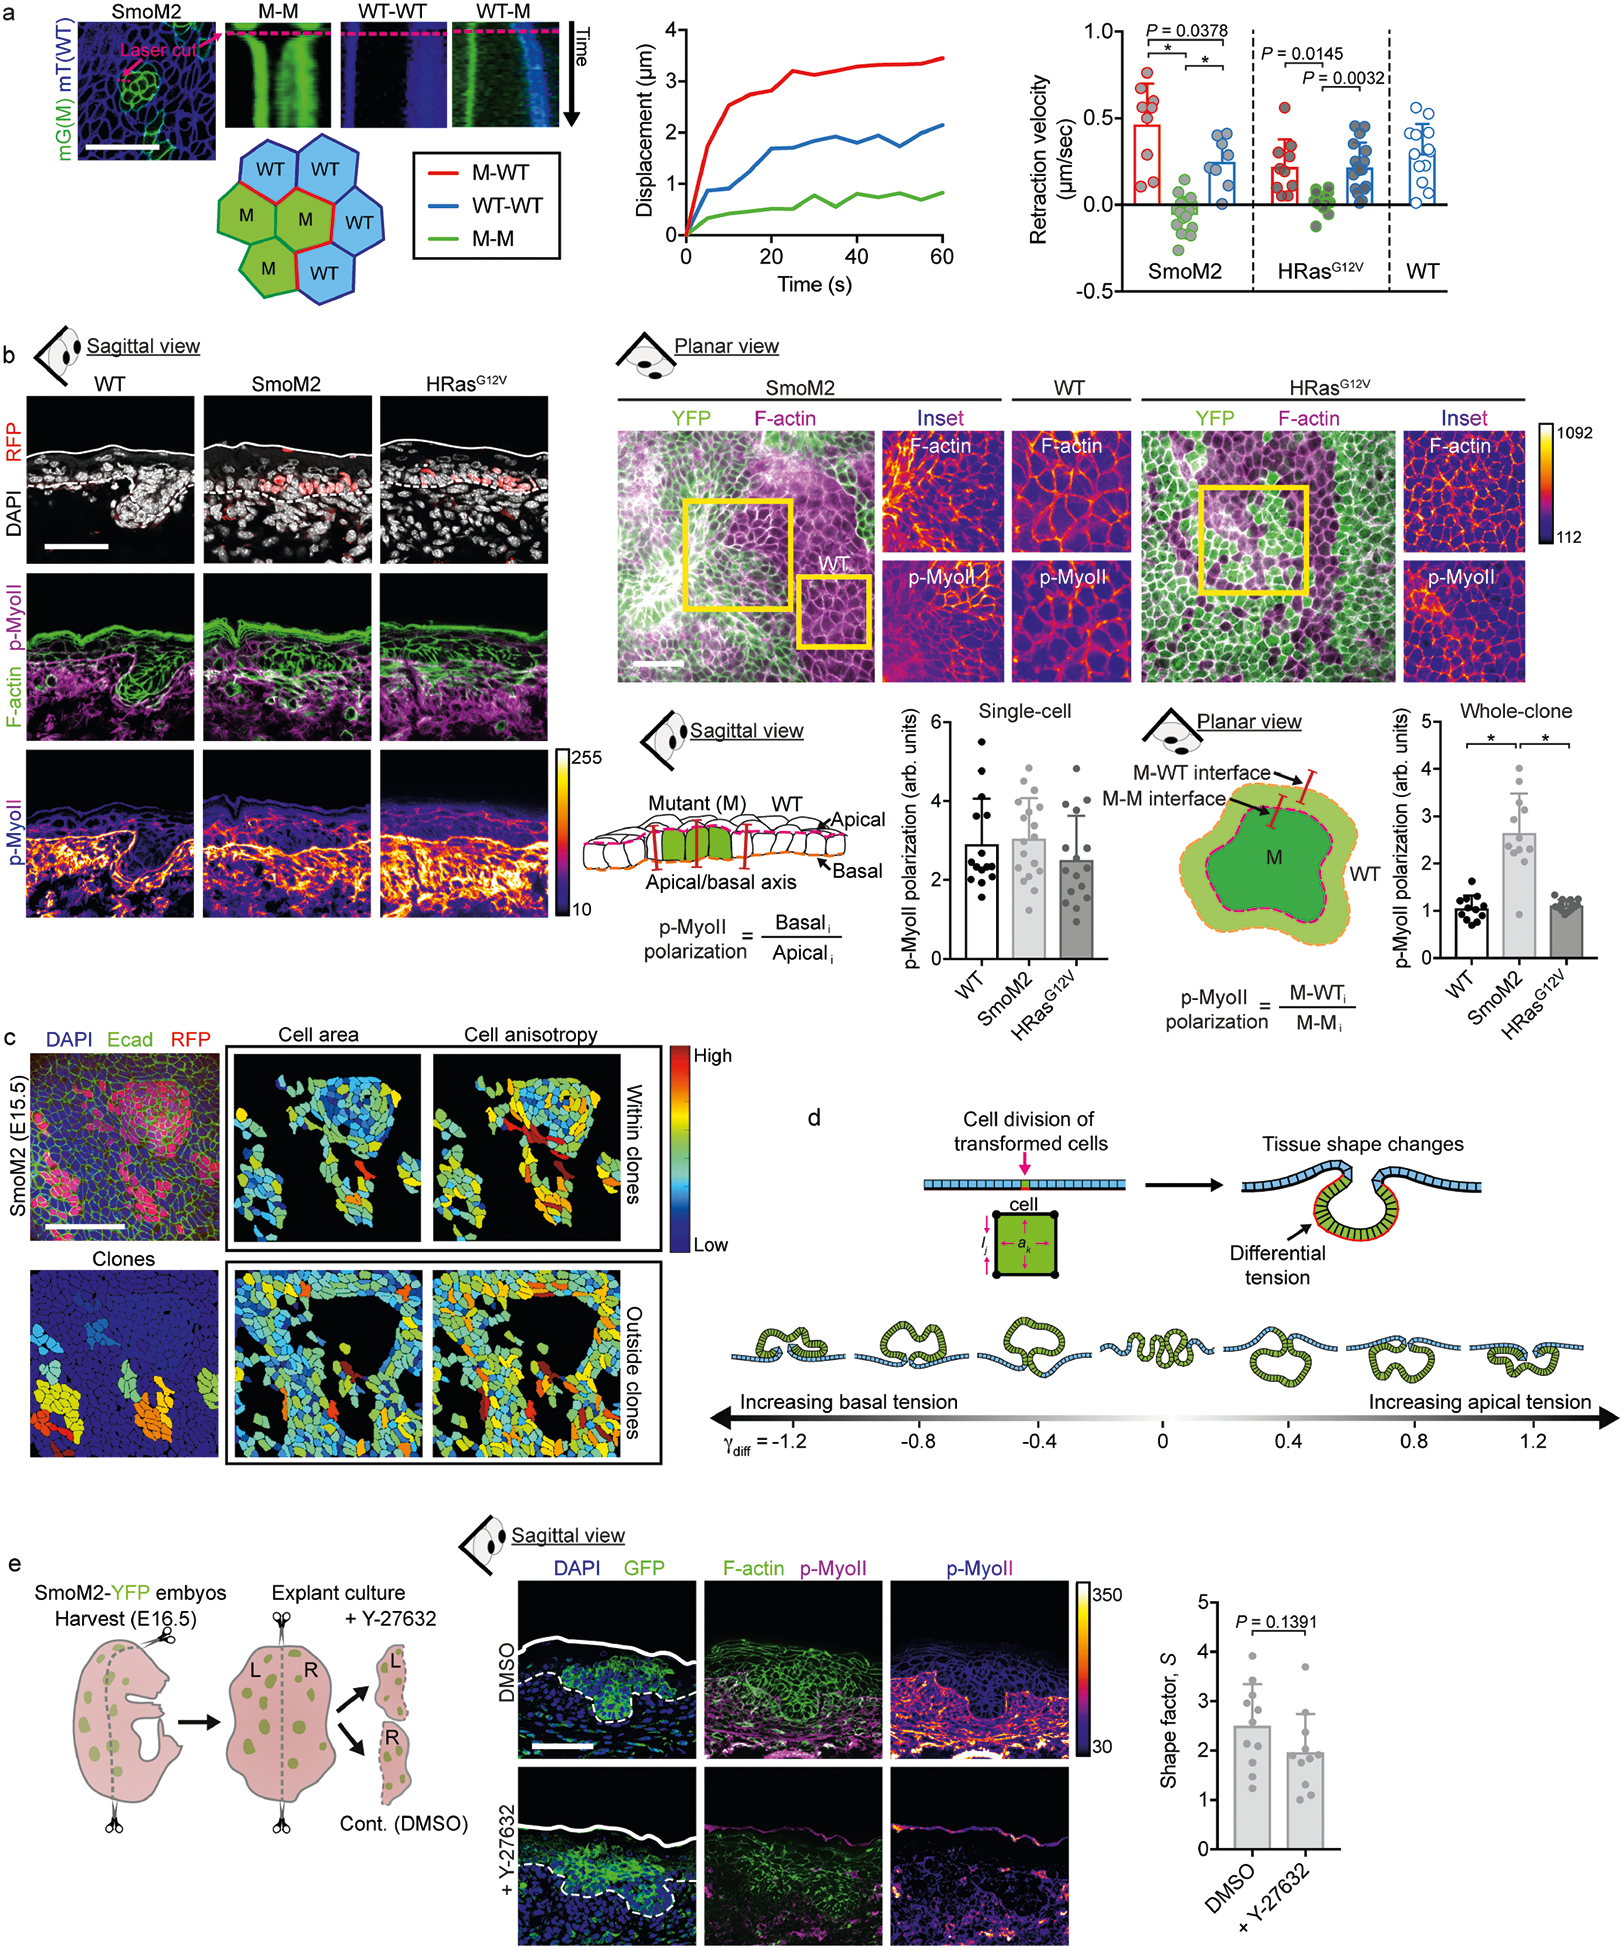
Extended Data Fig. 3 |. Role of interfacial actomyosin tension in a monolayer and multilayered epithelium.

a, Left, example time-lapse kymographs showing junctional laser ablation. Plasma membranes are marked by membrane-Tomato and membrane-GFP (mT and mG) in SmoM2;mTmG and HRasG12V;mTmG mice, with mutant cells (M) in green, wild-type (WT) cells in blue, and M–WT/WT–WT/M–M interfaces labelled. Laser cut sites are marked with pink dashed lines. Centre and right, the displacement of neighbouring tricellular junctions was quantified over time to yield retraction velocity curves. Initial retraction velocity values are shown for WT (n = 13), SmoM2, (M–WT, n = 9; M–M, n = 17; WT–WT, n = 8) and HRasG12V (M–WT, n = 10; M–M, n = 16; WT–WT, n = 17; one-way ANOVA with Tukey’s multiple comparisons test) from four to five embryos from two litters for each condition. b, Immunofluorescence staining of F-actin (using phalloidin) and phospho-S19-myosin-II (p-MyoII) in SmoM2 and HRasG12V lesions in sagittal sections (left) and planar whole-mount (right) views at E15.5. The intensity of staining is shown in heatmap values. p-MyoII polarization was measured in single basal cells (along the apicobasal axis, sagittal view; WT, n = 15; SmoM2, n = 18; HRasG12V, n = 16; one-way ANOVA with Tukey’s multiple comparisons test) and in whole clones (M–WT versus M–M interface, planar view; WT, n = 12; SmoM2, n = 12; HRasG12V, n = 16). Note that although p-MyoII is enriched basally, this polarization does not change between WT epidermal progenitors and oncogenic basal cells. c, Cell shapes analysed from E15.5 SmoM2 mutant clones. Cell area and anisotropy (defined as the ratio of major and minor cell axes) were analysed from whole-mount confocal images. Cells were automatically segmented on the basis of cortical E-cadherin staining. Note the increased anisotropy in M and WT cells at the clone border and the diminished cell area at the clone centre. d, The monolayer model epithelium. A single cell is transformed (green) and then undergoes cycles of division to induce tissue growth and deformation (see Supplementary Note 1). Interfacial tensions were varied in magnitude and orientation from basally to apically polarized, resulting in evaginating or invaginating lesions, respectively. e, Explant cultures treated with the actomyosin inhibitor Y-27632. SmoM2 oncogenic skin explants were treated with Y-27632 or vehicle control (DMSO) for 24 h before preparing the tissue for microscopic analysis (n = 11 lesions from three explants each; two-tailed unpaired t-test). All bar graphs show means + s.d. Scale bars, 50 μm. *P < 0.0001.
