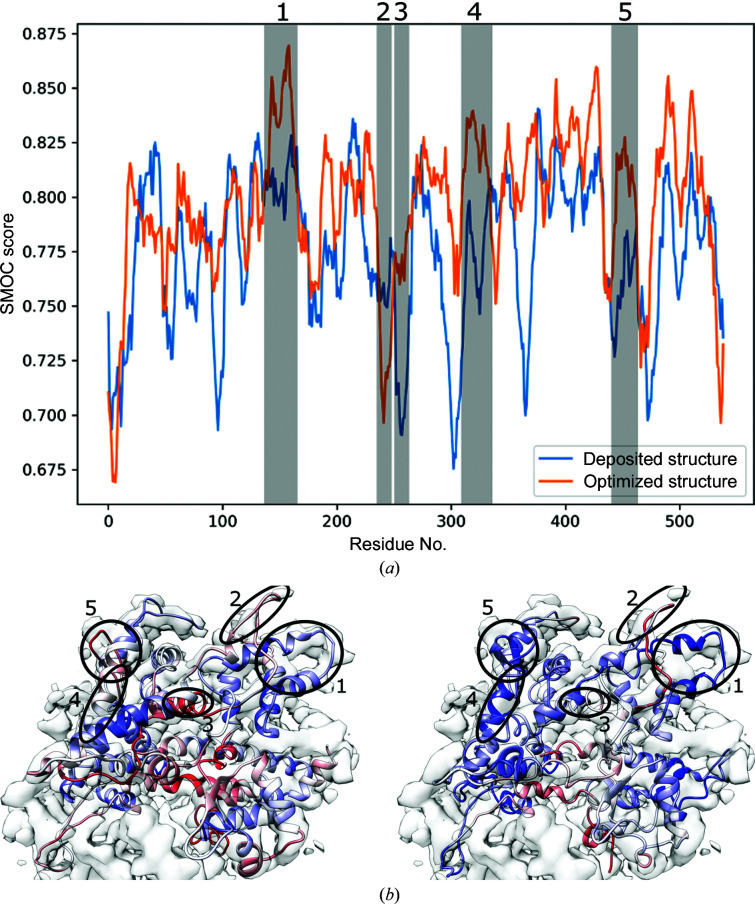
Figure 7.
(a) SMOCf profile computed for chain C of RNA polymerase III (PDB entry 5fj8) against the experimentally determined map (EMDB entry EMD-3178) (Hoffmann et al., 2015 ▸) before (blue) and after (orange) optimization. Regions of significant changes are shaded and numbered. (b, c) Deposited (left) and optimized (right) structures of chain O, aligned with the map, coloured by SMOC score. Blue represents higher scores; red represents lower scores. The circled regions correspond to those in (a).

