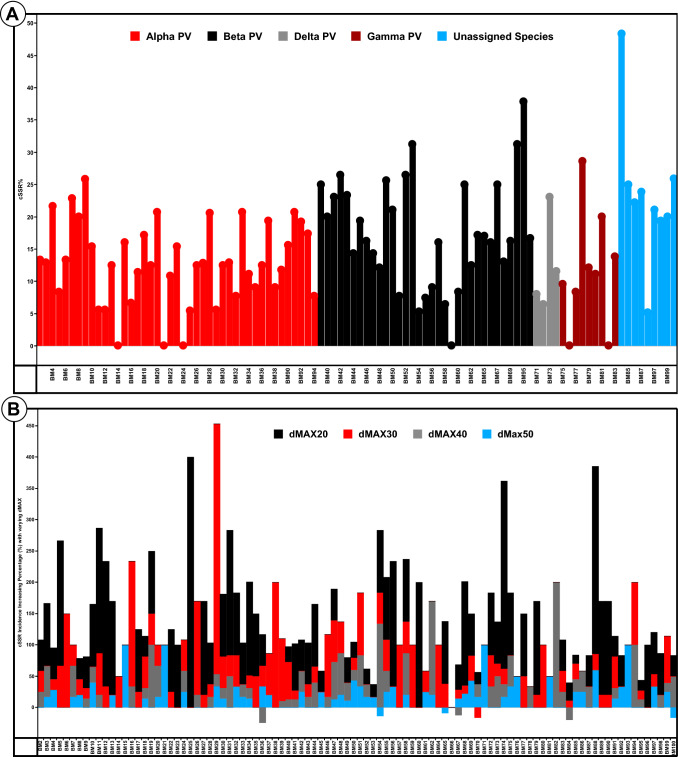
Fig. 2.
a cSSR% in the studied Polyomaviridae genomes. Percentage of individual SSRs as part of cSSRs is cSSR%. The data for all the genera are differentially coloured. Not only there is diversity across the genera but also within the genomes of the same genera as well. Interestingly, BM84 which has the highest cSSR% is yet to be classified into any genera. b Percentage increase in cSSR incidence with increasing dMAX (10–50). Note the non-linearity in increase. Negative bars represent a decrease in cSSR incidence when two cSSRs merge into one with increasing dMAX

