
Fig. 3.
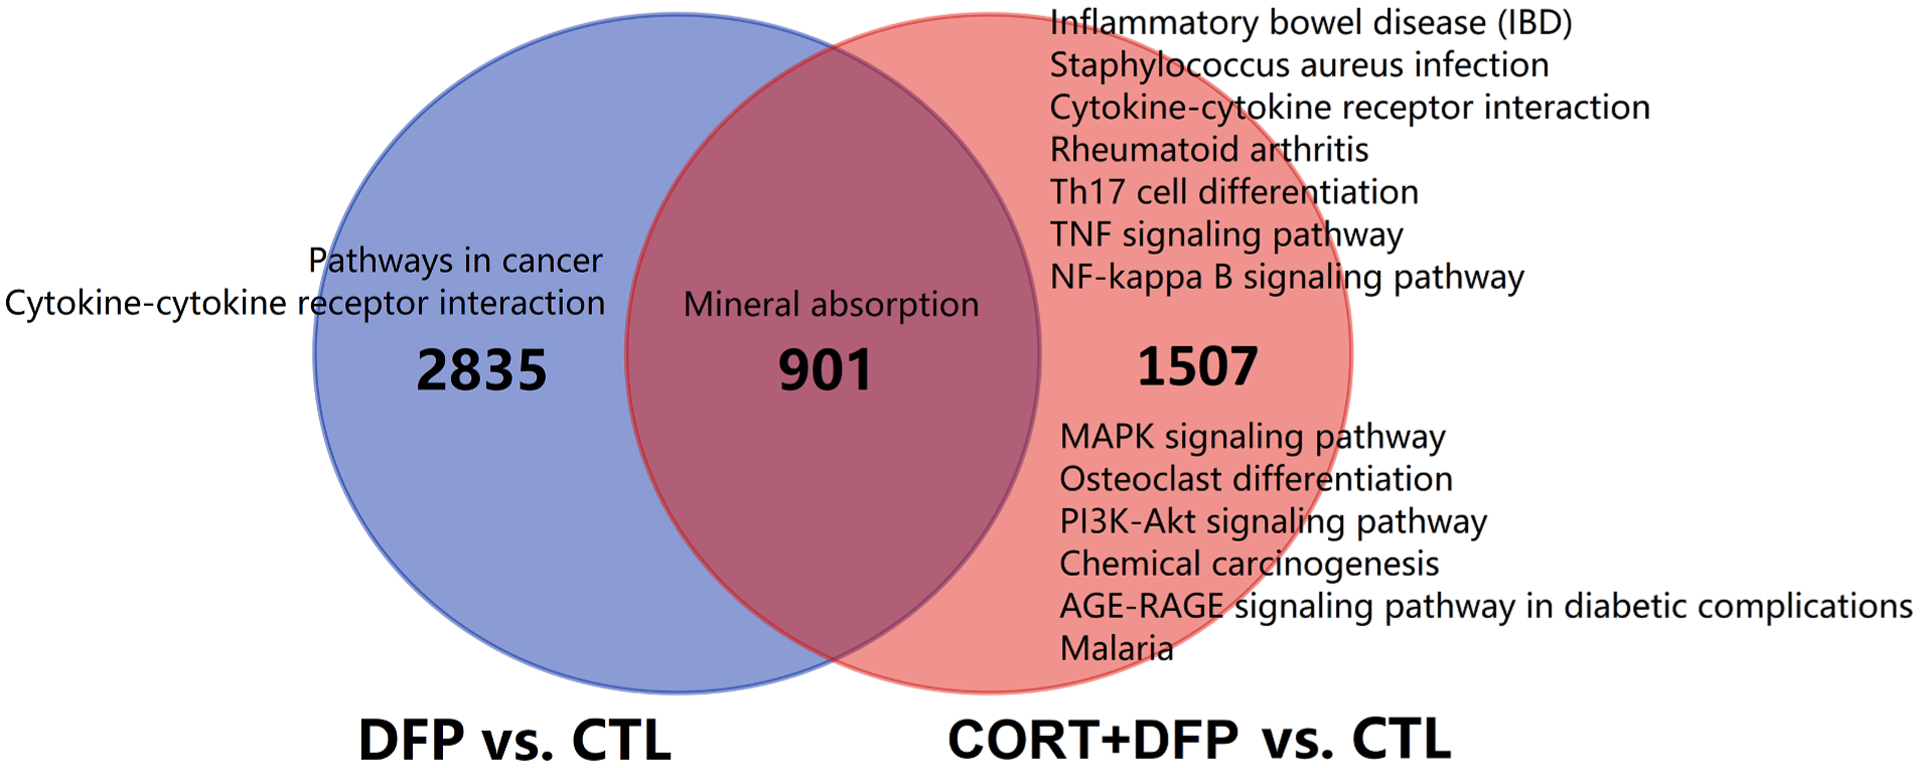
Venn diagrams showing the overlaps for the DEGs between DFP vs. CTL and CORT + DFP vs. CTL. The numbers indicated common or unique genes for those two groups. For each gene set, KEGG pathway enrichment analysis was conducted with WebGestalt (http://www.webgestalt.org/) and the significant enriched terms (FDR < 0.05) was listed alongside the diagrams.