
Fig. 4.
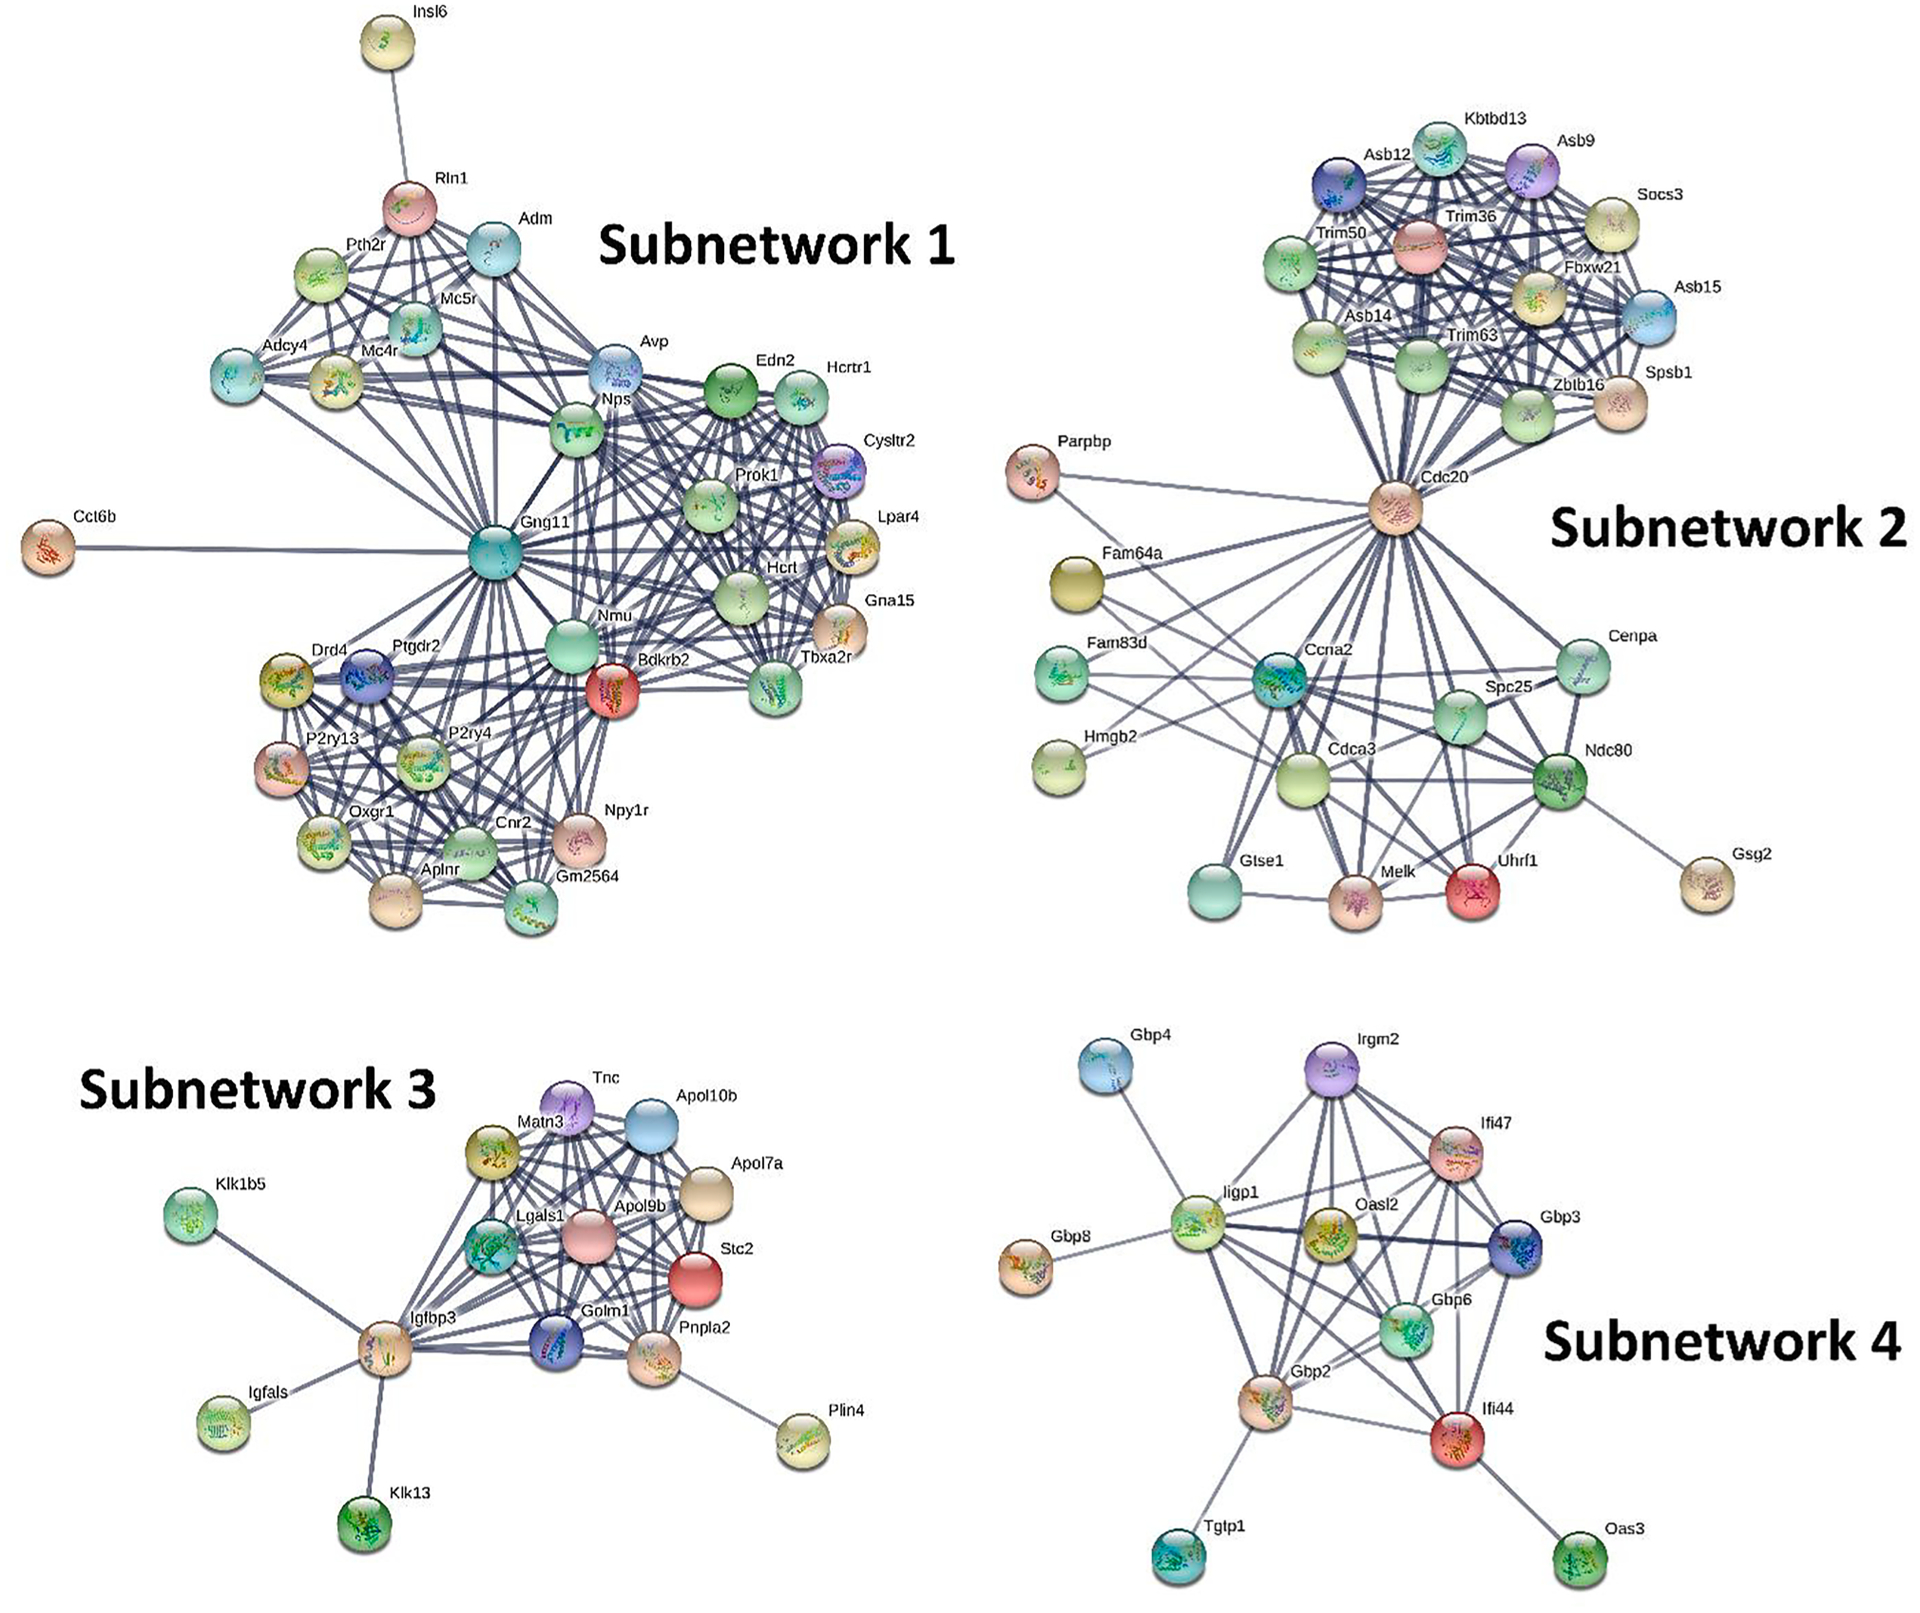
PPI subnetworks for the DEGs between DFP and CTL. The most salient DEGs were submitted to STRING (https://string-db.org/) for searching PPIs. Then followed by MCL subnetwork clustering with a minimum required interaction score of 0.7 and inflation parameter of 3. In each subnetwork, nodes represent genes while edges represent PPIs between two genes.