
Figure 1:
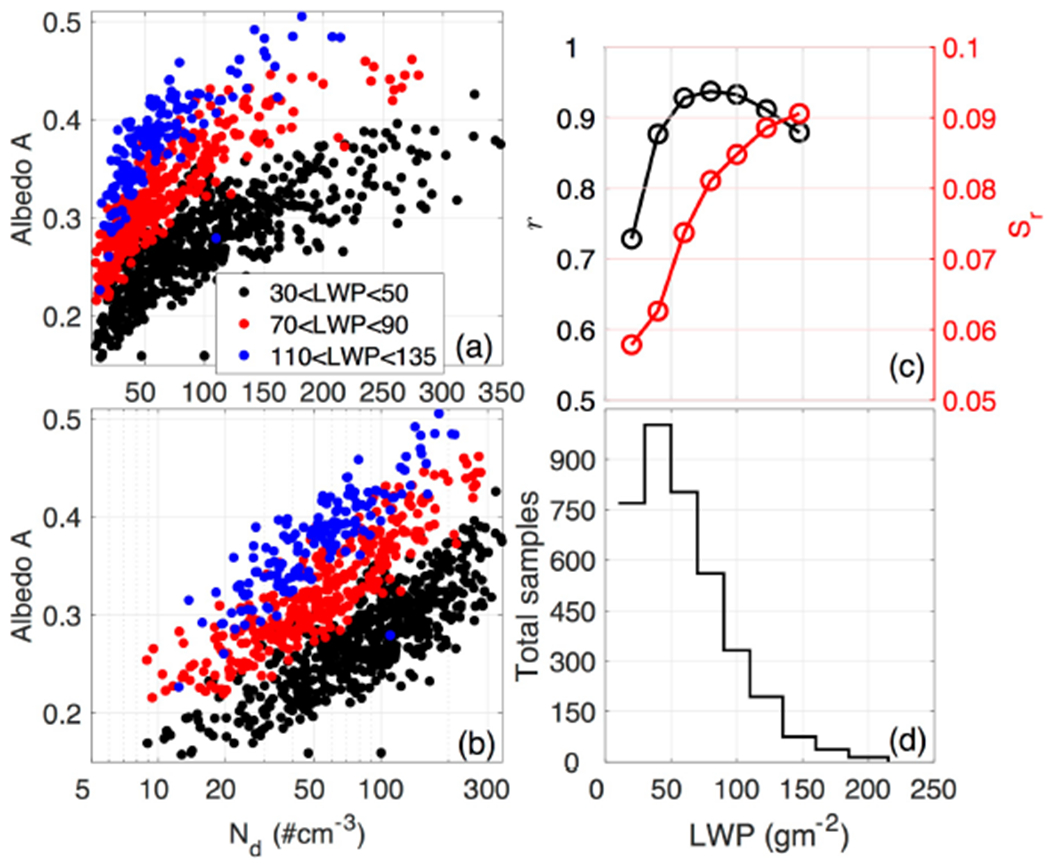
Example of the relationship between Nd and A in a) linear and b) semi-logarithmic scale for three LWP bins. c) linear correlation coefficient (black) and relative susceptibility (Sr, red line) for each LWP bin. d) number of samples contained in each LWP bin. The statistics are taken off the coast of California (127°W, 32°N) in NH summer.