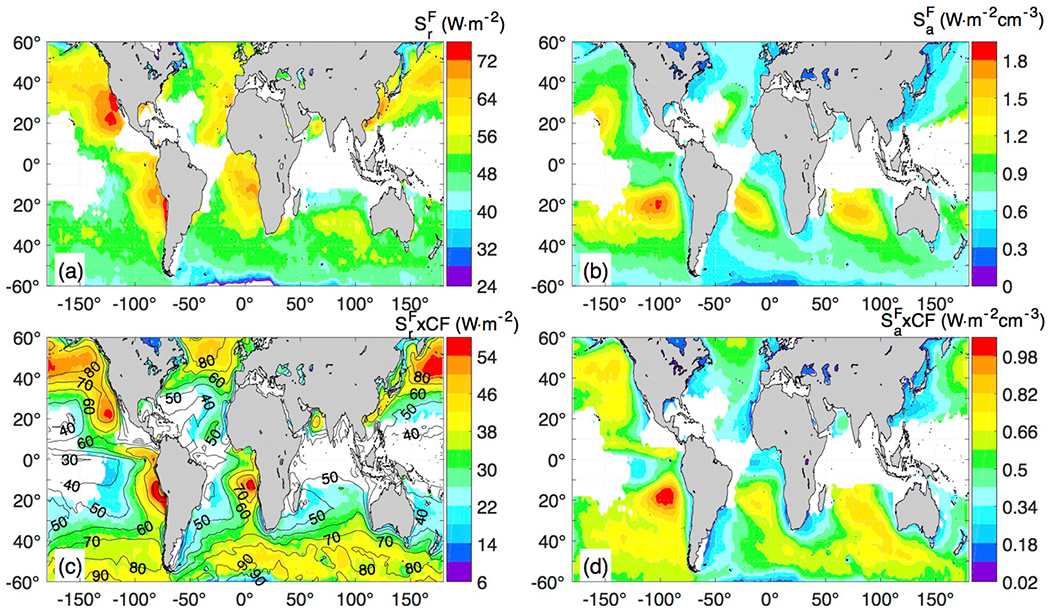
Figure 5:

Annual relative (a) and absolute (b) shortwave flux susceptibilities. c) and d) as in a)-b) but multiplied by cloud fraction. Contours in Fig 5c are cloud fraction in percentage. The corresponding figure for Sr and Sa for albedo is presented in Fig. S5.
