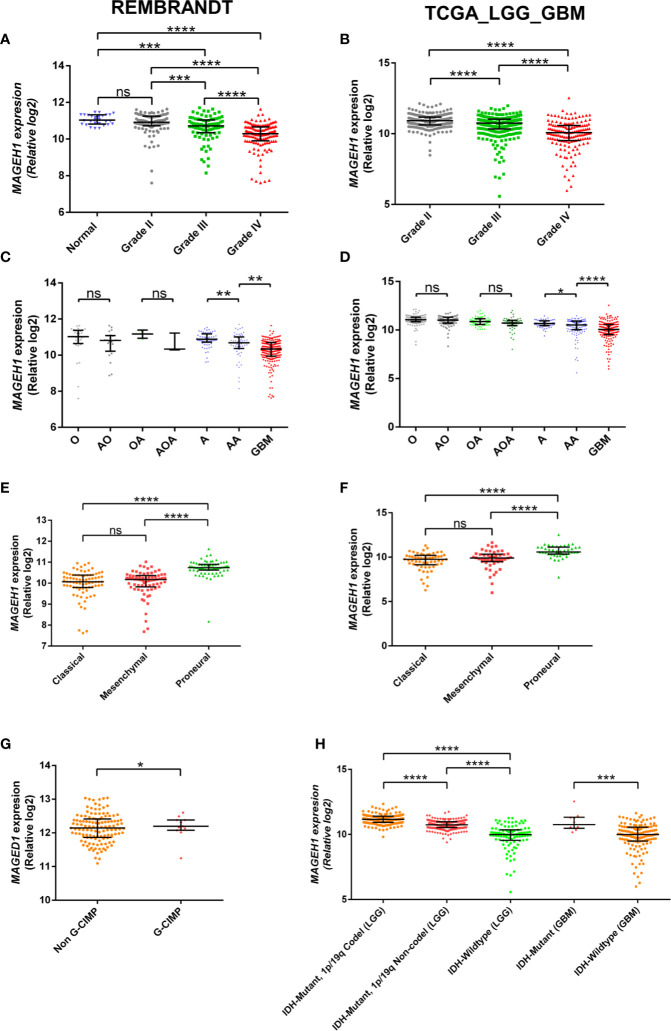
Figure 2.
MAGEH1 gene expression in glioma datasets, Rembrandt (left) and TCGA-LGG-GBM dataset (right) for (A, B) Different glioma grades, (C, D) Histological subtypes of LGG with GBM, (E, F) Molecular subtypes of GBM, (G) G-CIMP status in Rembrandt dataset, (H) IDH and 1p19q codeletion status in TCGA dataset. ****p<0.0001, ***p<0.001; **p<0.01; *p<0.05; ns, not significant.

