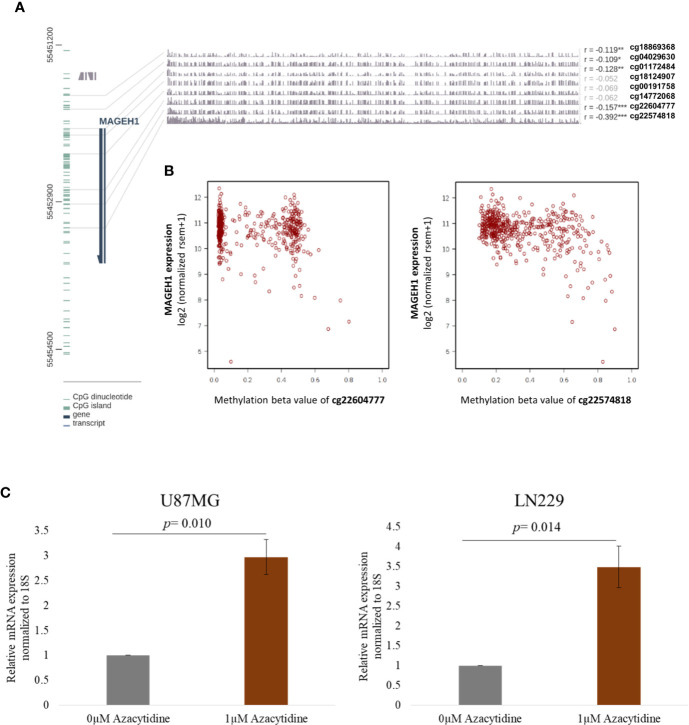
Figure 4.
DNA methylation and its correlation with MAGEH1 expression (A) DNA methylation of the MAGEH1 promoter region in TCGA-LGG dataset (B) Correlation of DNA methylation at cg22604777 and cg22574818 with MAGEH1 expression in TCGA-LGG dataset. (C) Effect of 5-Azacytidine treatment on MAGEH1 expression in GBM cell line U87MG and LN229. ***p<0.001; **p<0.01; *p<0.05. Faded correlation values shows non significant associations.

