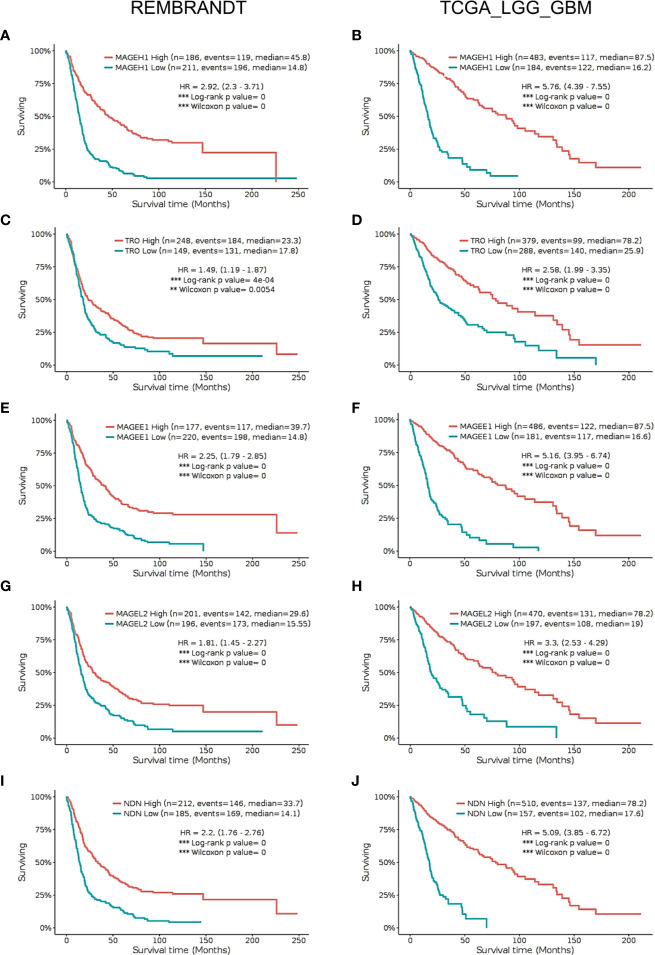
Figure 5.
Kaplan Meier survival analysis in REMBRANDT dataset (Left panel) and TCGA dataset (right panel) for selected type 2 MAGE genes including all cases. (A, B) MAGEH1 (C, D) TRO (E, F) MAGEE1 (G, H) MAGEL2 (I, J) NDN. Patients were divided into two groups based on maximally selected rank statistics function available in the GlioVis web server (see Materials and Methods for detail). The Log-rank p-value has been depicted in each graph. ***p<0.001; **p<0.01; *p<0.05.

