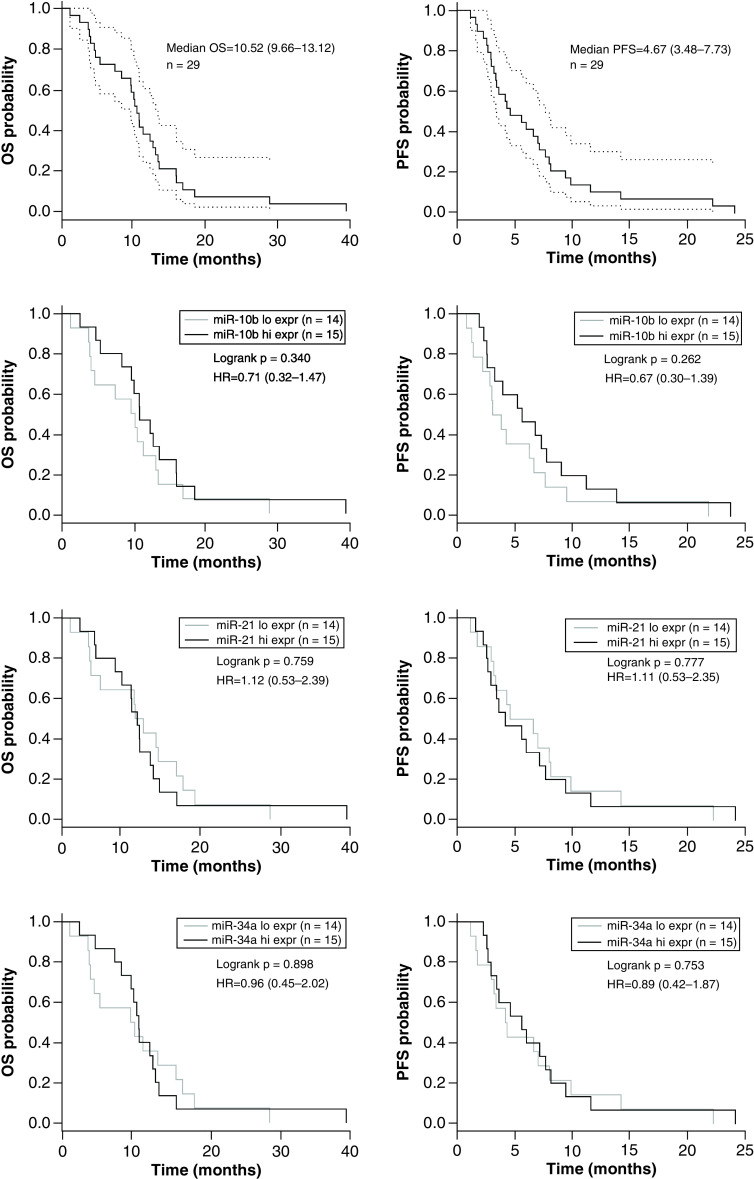
Figure 2. . Overall and progression-free survival Kaplan–Meier plots for the overall population and for the microRNA expression groups (high vs low) of miR-21-5p, miR-10b-5p and miR-34a-5p.
Median OS and median PFS are shown for overall study population including CIs in the first row. In the following blots median OS and median PFS based on the median dichotomized microRNA expression groups (high vs low) are illustrated for miR-21-5p, miR-10b-5p and miR-34a-5p.
Hi expr: High expression; HR: Hazard ratio; Low expr: Low expression; OS: Overall survival; PFS: Progression-free survival.

