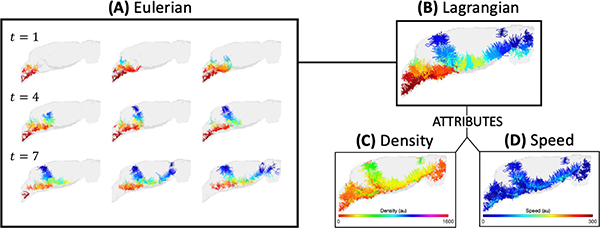
Fig. 1.
Eulerian and Lagrangian visualizations of flow dynamics. (A) For each time point, streamlines are computed at a fixed set of initial locations. Color is used to distinguish streamline clusters and time-varying flow behavior is observed by comparing streamlines across time. (B) Alternatively, temporal changes in particle trajectories are encompassed by pathlines and presented in a single image. Time-varying particle attributes associated with the pathlines, such as (C) density and (D) speed, exemplify the simplistic yet informative nature of our unified visualization framework.

