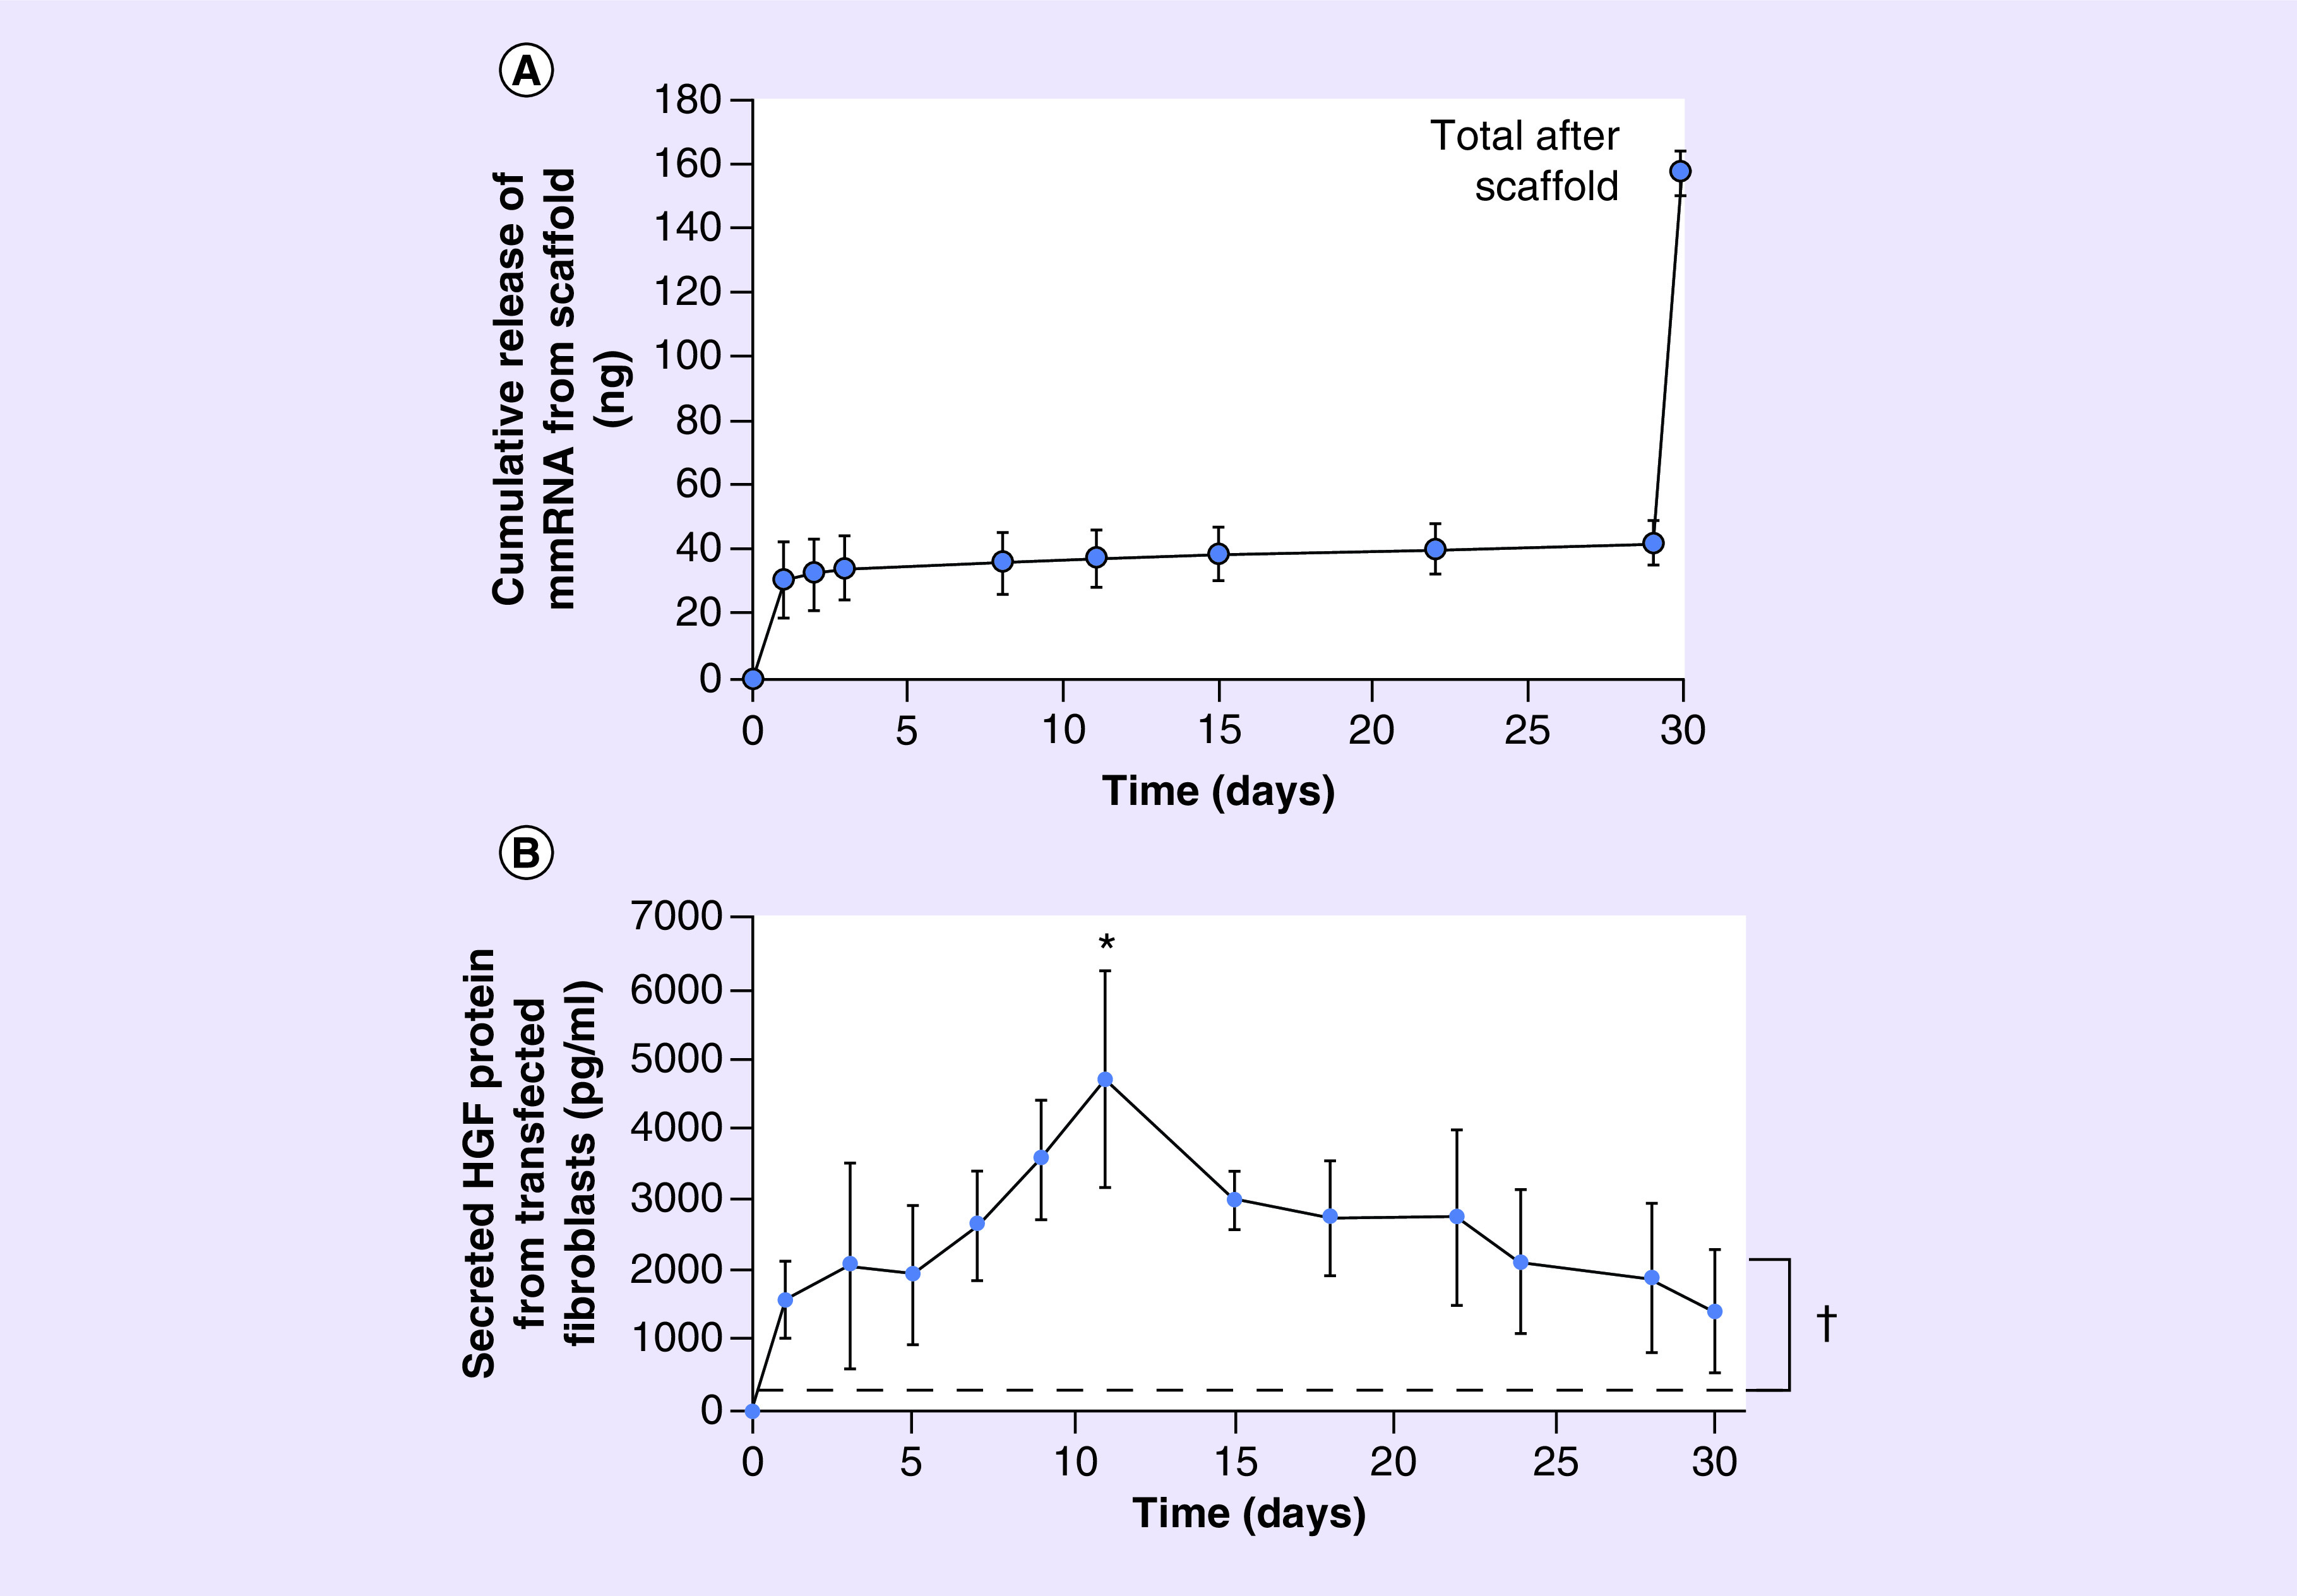
Figure 2. . Characterization of HGF mmRNA release and HGF protein release in vitro.

(A) Cumulative mmRNA release from HGF mmRNA-loaded aligned nanofibrillar scaffold (n = 3). (B) HGF concentration in media from fibroblasts cultured on HGF mRNA-loaded scaffold, quantified by HGF ELISA (n = 4). Dotted line denotes the highest detectable level of endogenous HGF in control samples. *Denotes statistically significant relationship, compared with day 0 (p < 0.05).
†Statistically significant compared with endogenous HGF protein concentration in control samples (p < 0.05).
