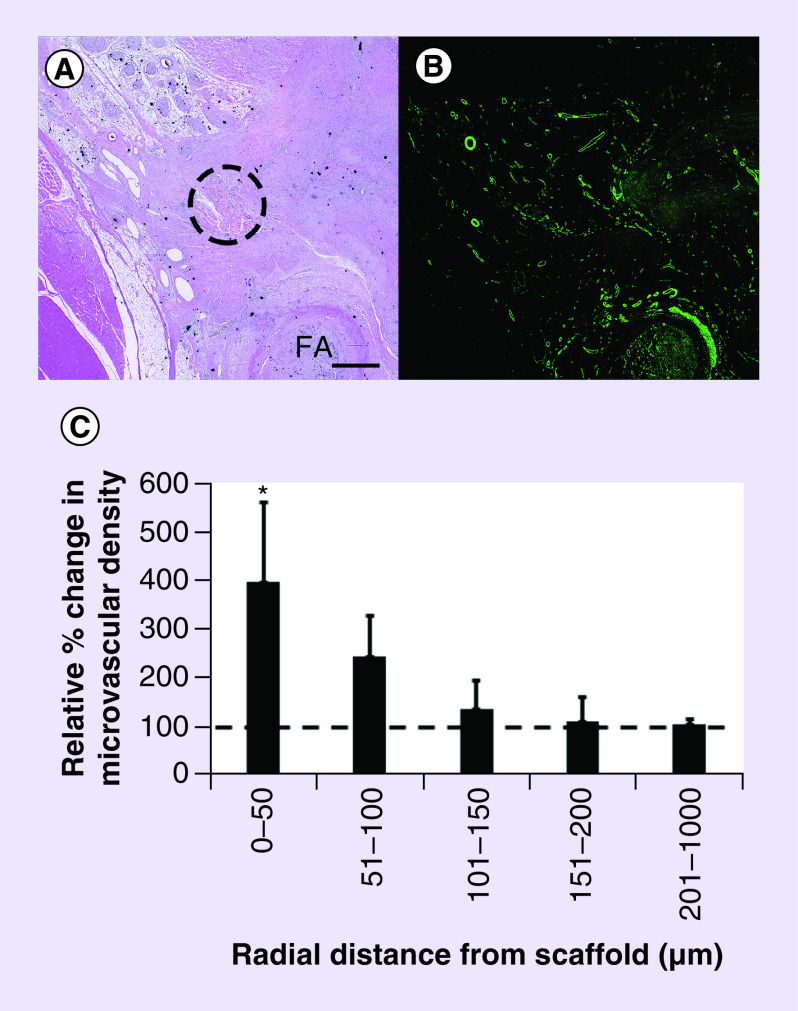
Figure 6. . Histological analysis of microvascular density.
(A) H&E staining of the implantation site with occluded FA and scaffold. Dotted circle denotes location of scaffold. (B) Corresponding tissue section immunofluorescently stained for microvessels using α-SMA antibody. (C) Quantification of relative percent change in microvascular density in the vicinity of HGF mmRNA-releasing scaffold, compared with surrounding tissue >1000 μm in radial distance away from the scaffold (n = 3). Dotted line denotes the relative microvascular density in the surrounding tissue. Scale bar denotes 1 mm.
*Denotes statistically significant difference in comparison to surrounding tissue (p < 0.05).
FA: Femoral artery; H&E: Hematoxylin and eosin.

