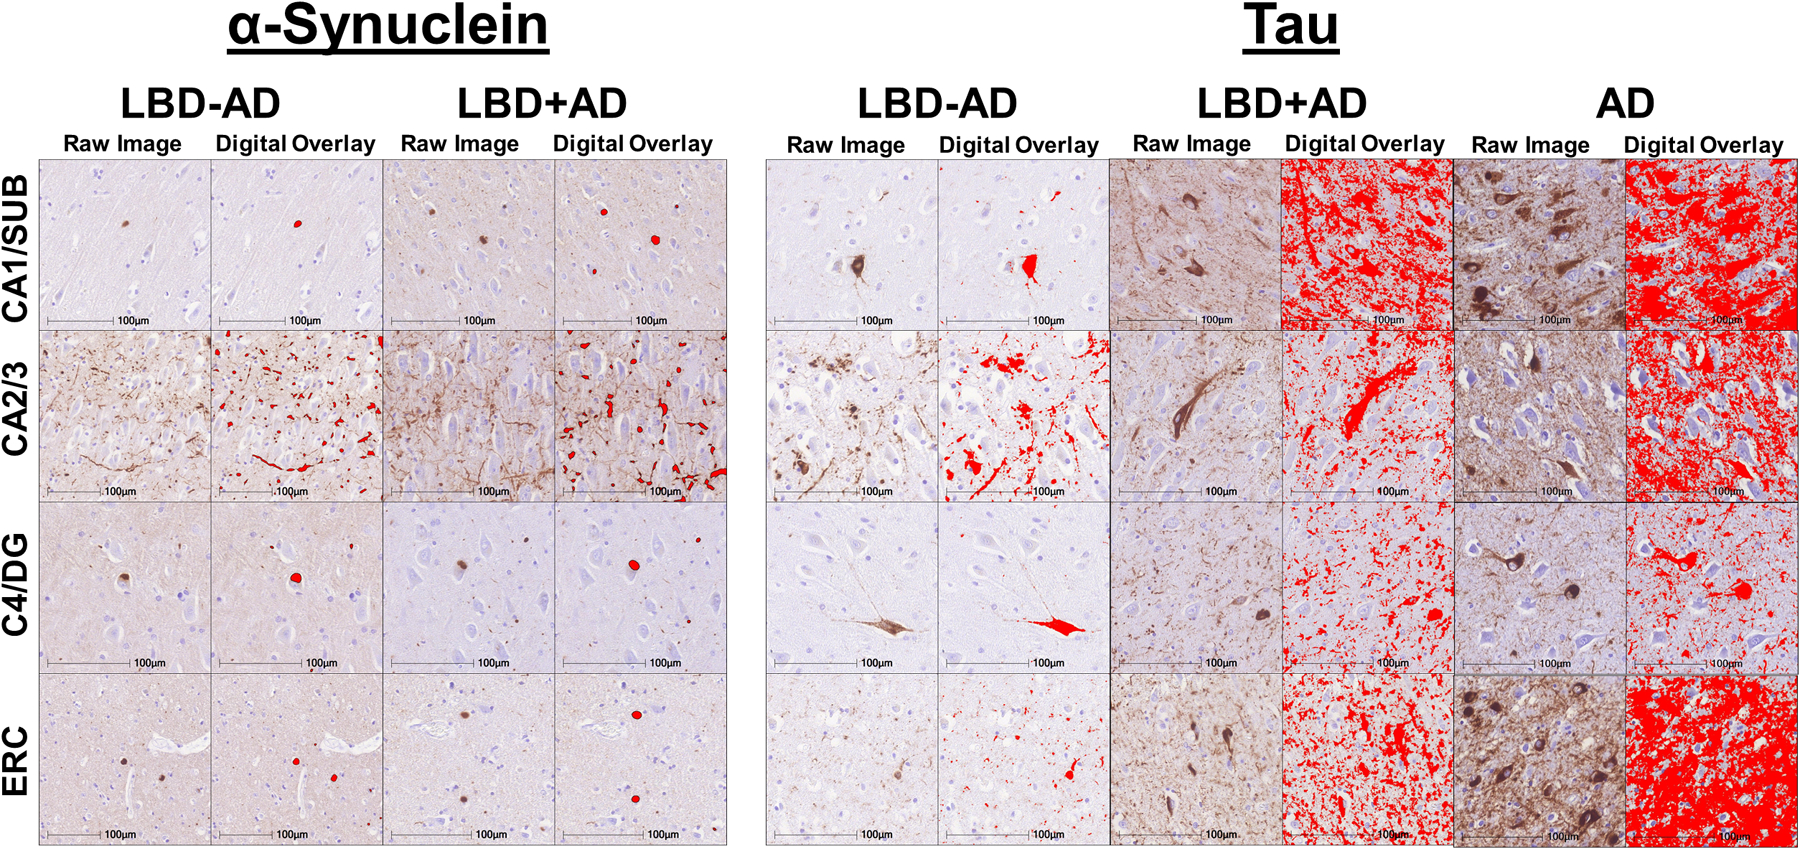
Figure 2. Digital Histology Detection Overlay.

Representative photomicrographs in different hippocampal subfields in LBD-AD, LBD+AD, and AD cases stained for SYN (SYN303) and tau (AT8) The first column for each group shows raw images and the second column for each group depicts digital detection of pathology (%AO- red overlay).
