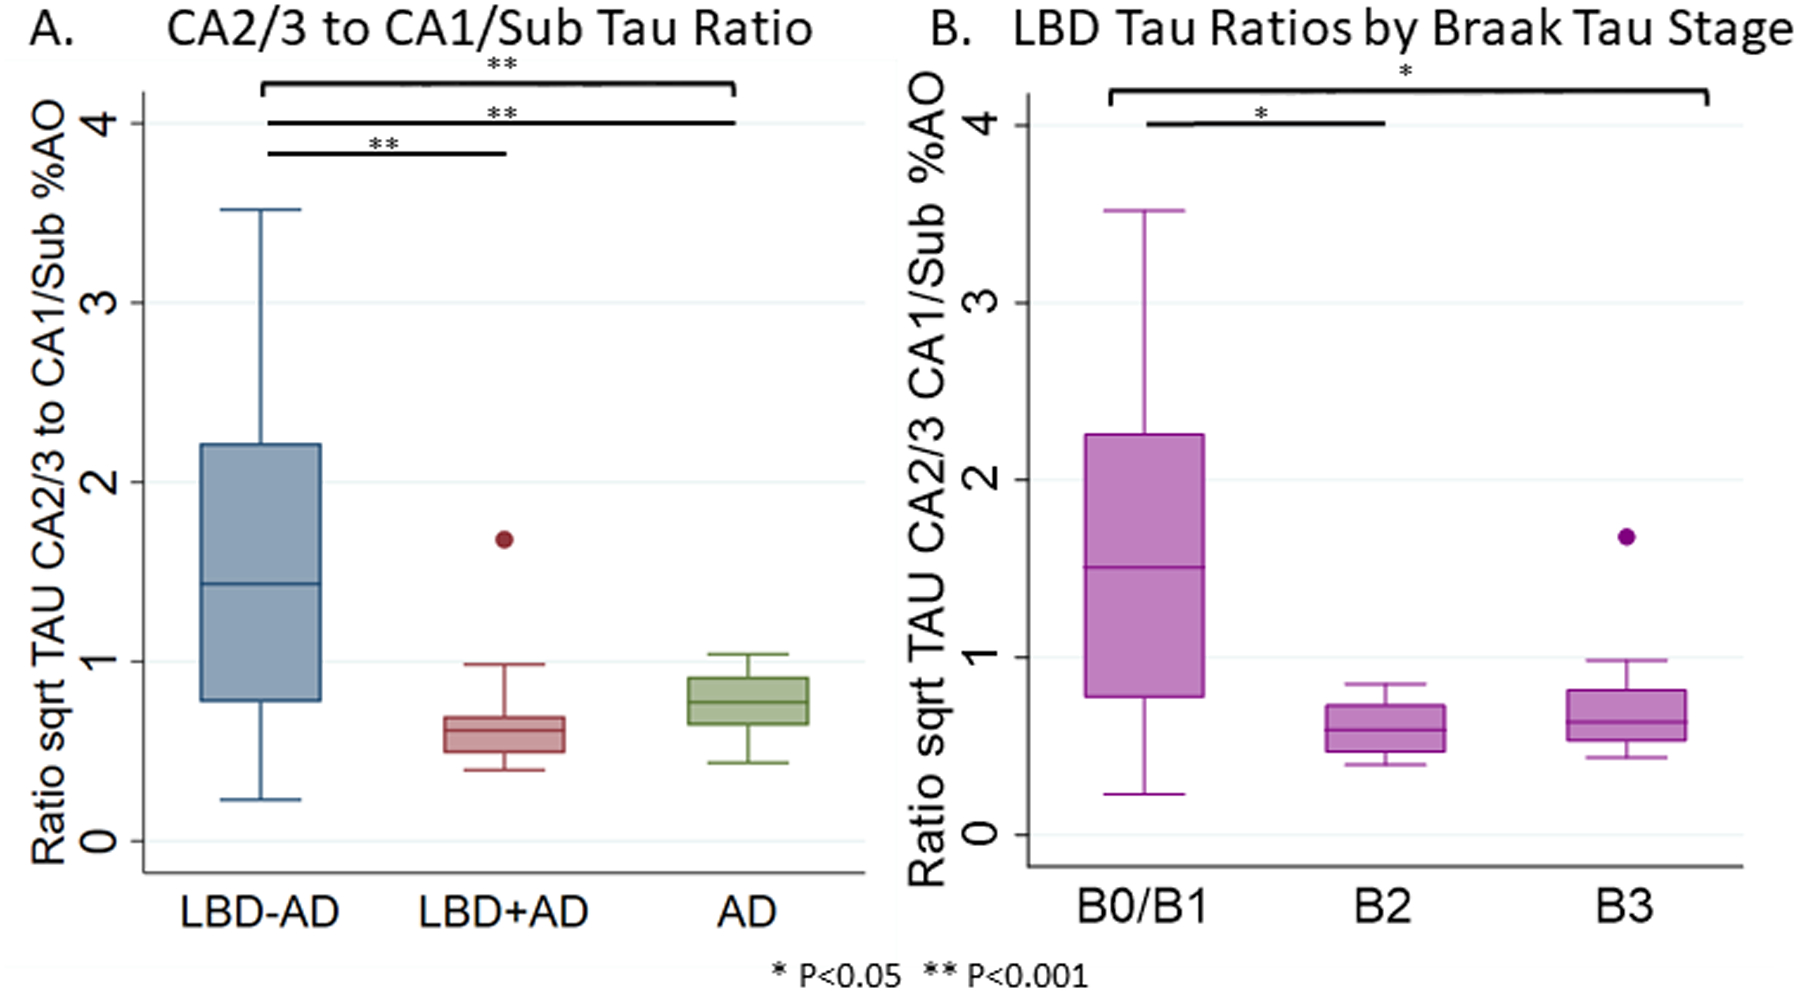
Figure 5. Ratio of CA2/3 Tau to CA1/SUB Tau.

Box-plots depict median, interquartile range and range of the ratio of the square root of tau %AO in CA2/3 to CA1/SUB in A) LBD-AD (blue), LBD+AD (red), and AD (green) and B) in the entirety of the LBD cohort by Braak tau stage. Brackets indicate ANOVA differences across all groups, while lines indicate significant differences between groups. * p<0.05 ** p<0.001.
