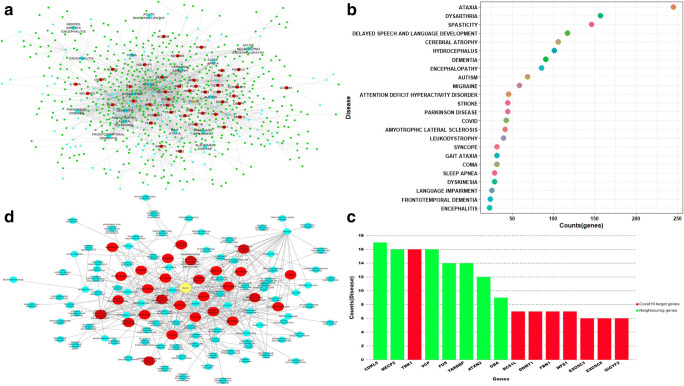
Fig. 3.
a Disease gene interaction network: the figure represents the interaction of CTN network genes with their related brain disorder. COVID-19 target genes are represented in red, neighboring genes of COVID-19 target genes are represented in green, diseases are represented by blue color, and COVID-19 disease is represented by yellow color. b Dot plot of highly connected diseases and the number of genes associated with disease in the brain’s gene-disease interaction network. c Bar plot of genes highly connected to multiple diseases in the brain’s gene-disease interaction network. d Brain’s disease-disease interaction network. Red color nodes represent the disease directly connected to COVID-19

