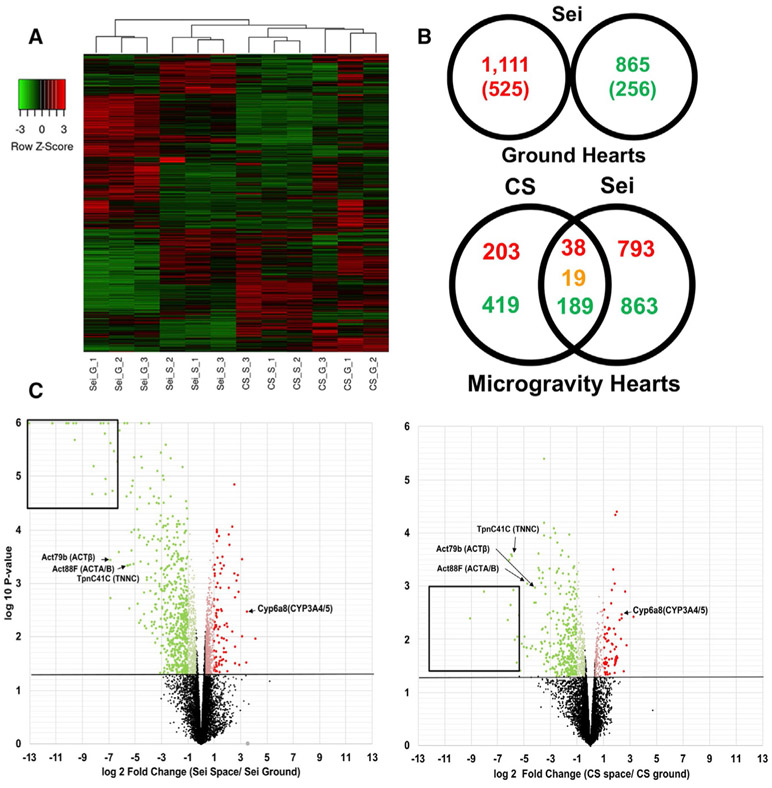
Figure 2. RNA-Seq Analysis of Differential Transcriptome Expression in Drosophila Cardia under Microgravity.
(A) Average linkage cluster analysis using Kendall’s Tau distance measurement method comparing Canton-S GCs (CS_G), Canton-S microgravity exposed (CS_S), sei/hERG GCs (SEI_G), and sei/hERG microgravity exposed (SEI_S) fly hearts. Column dendrograms showed samples clustered by both genetic background and (micro)gravity exposure. Genes (rows) normalized using row Z score. p < 0.05, 1.2-fold (p < 0.01, 2.0-fold in parenthesis)
(B) Differentially expressed genes in sei/hERG mutants at 1g (top). Venn Diagram of up (red) and down (green) regulated genes in CS and sei/hERG under microgravity normalized to their respective GCs (bottom). Overlap denotes shared up- and downregulated genes. Orange denotes contra-regulated genes.
(C) Volcano plots of CS (left) and sei/hERG (right) under microgravity. Black box denotes highly downregulated chitin-related fly-specific clusters. Red denotes upregulated 2.0+-fold; light red, 1.25- to 1.99-fold; green, downregulated 2.0+-fold; light green, 1.25- to 1.99-fold. Triplicate samples of n = 20 fly hearts.

