FIGURE 4.
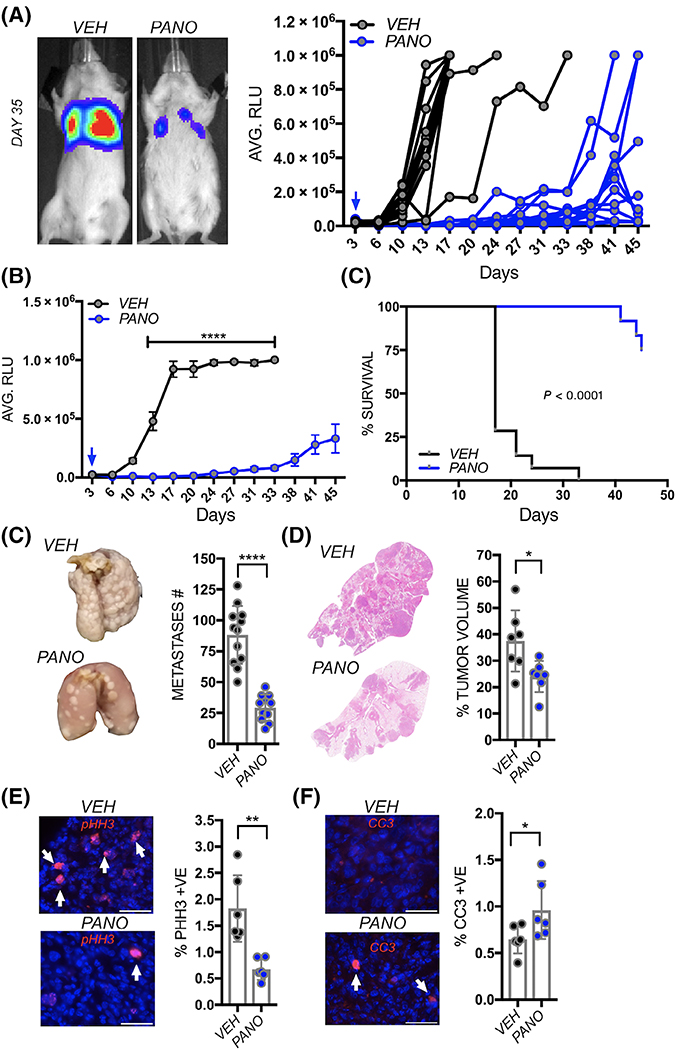
Panobinostat impairs the growth of established lung metastatic osteosarcoma. A, Spider plot of K7M2 bioluminescence over time in individual vehicle control (VEH; n = 12) and panobinostat (PANO; n = 12) treated mice. Treatment was initiated 3 days postinoculation of the osteosarcoma cells (blue arrow). Representative images show bioluminescence in each group at Day 35. B, Average of bioluminescence in vehicle control and treated mice. C, Kaplan-Meier curve of time to reach clinical endpoint in the panobinostat (PANO) and vehicle control (VEH) groups. D, Lungs from each group were inflated with formalin upon removal and the number of surface metastases (Metastases #) counted. E, Lung sections derived from each group were stained with hematoxylin and eosin and the percent tumor volume as a function of total lung volume calculated. F, G, ex vivo analyses from study endpoint of proliferative and apoptotic indices using phospho-histone H3 (pHH3; red arrows; F) and cleaved caspase 3 (CC3; red, arrows, G), respectively. Scale bars represent 50 μm. Asterisks denote statistical significance (*P < .05; **P < .01; ***P < .001)

