Figure 4.

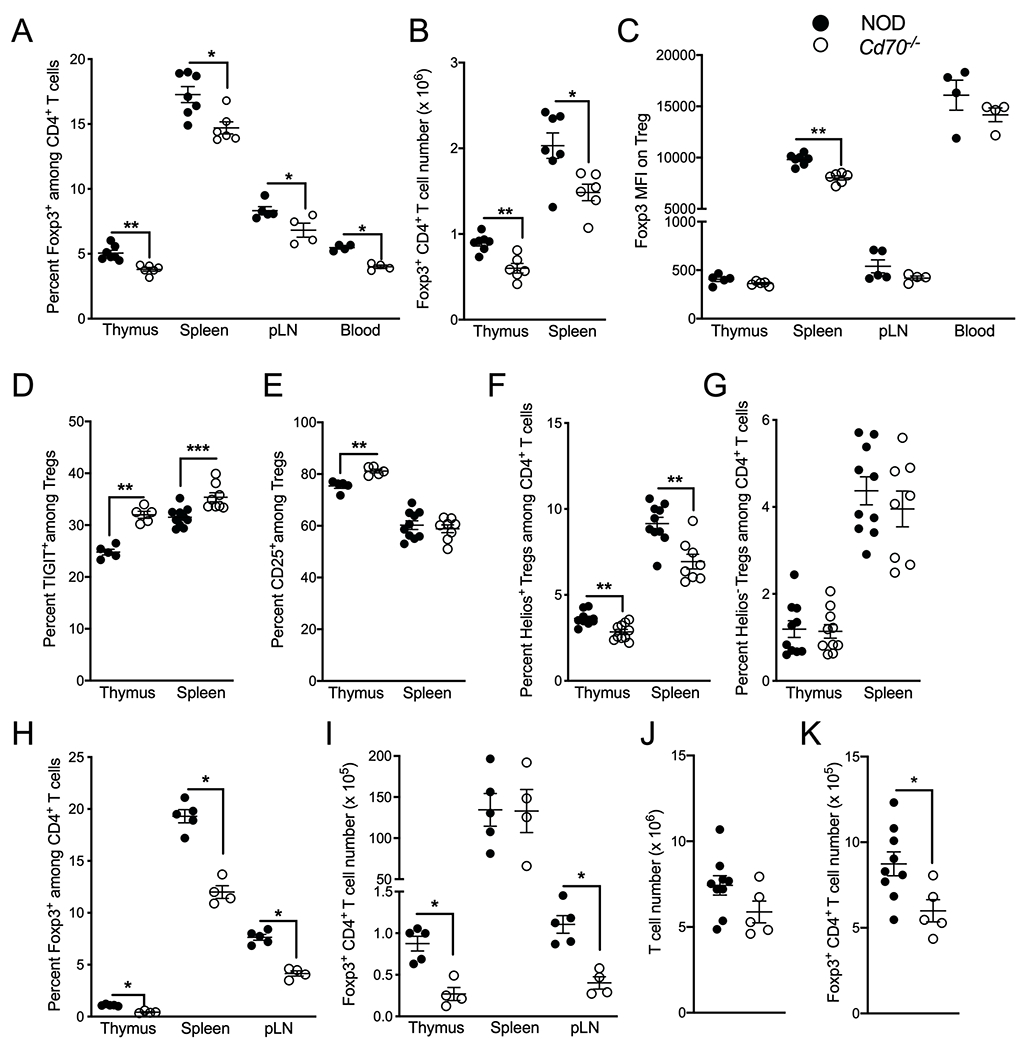
CD70 deficiency impairs Helios+ Treg development. (A) The proportion CD4+ T cells that express Foxp3 among thymocytes, splenocytes, pancreatic lymph nodes (pLNs) and blood of 7- to 10-week-old NOD and Cd70−/− mice. (B) The number of Foxp3+CD4+ Tregs from thymus and spleen of NOD and Cd70−/− mice. (C) The MFI of Foxp3 Ab staining of Tregs among thymocytes, splenocytes, pLN and blood of NOD and Cd70−/− mice. (D & E) Proportion of thymic and splenic Tregs that express TIGIT (D) and CD25 (E). (F & G) Percentage of Helios+ Tregs (F) and Helios− Tregs (G) among thymic and splenic CD4+ T cells of NOD and Cd70−/− mice. (H & I) The proportion CD4+ T cells that express Foxp3 (H) and the number of Foxp3+CD4+ Tregs (I) from thymus, spleen, and pLN of 8-week-old BDC2.5 TCR transgenic NOD and Cd70−/− mice. (J & K) The number of T cells (J) and Foxp3+CD4+ Tregs (K) from spleens of 3-week-old NOD and Cd70−/− mice. Each symbol represents a single mouse. Results are displayed as mean ± SEM and represent cumulative data from at least two independent experiments that were analyzed by the Mann-Whitney test. *P < 0.05, **P < 0.01, ***P < 0.001.
