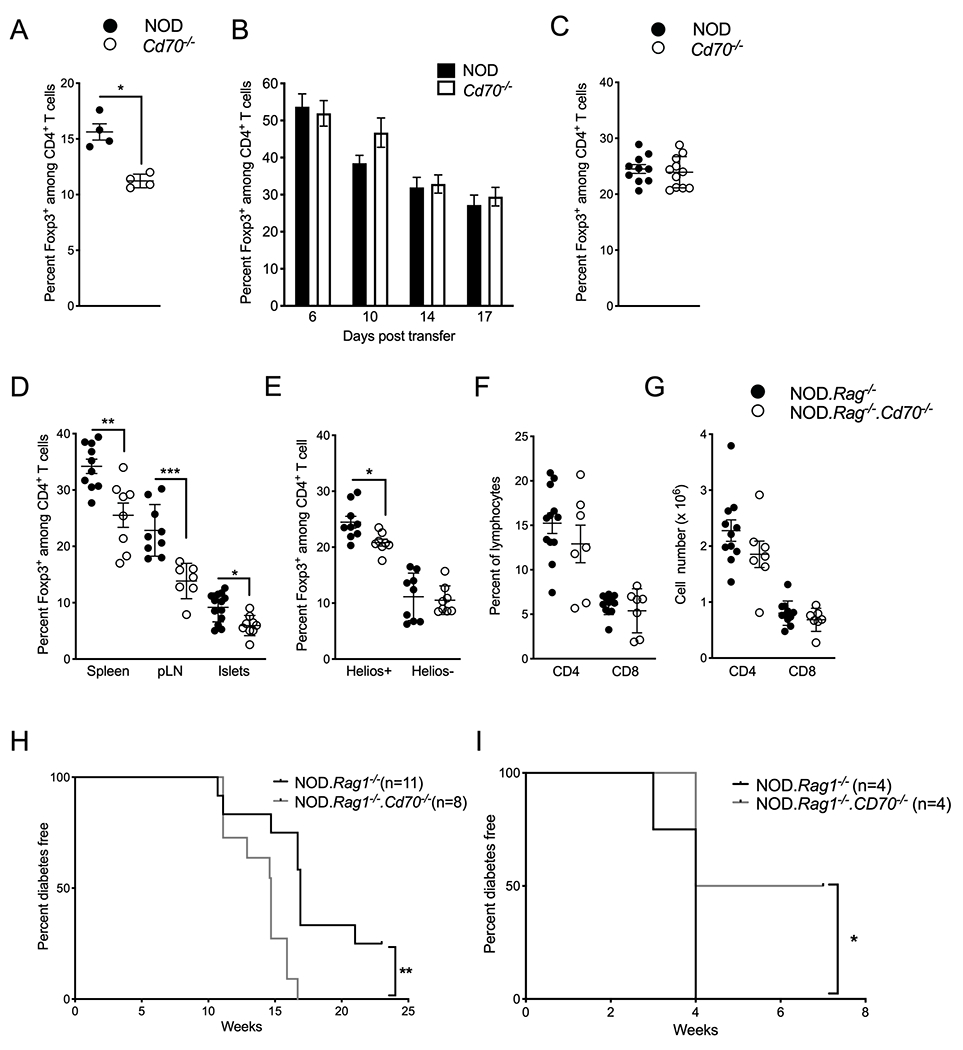
Figure 7.

CD70 expression by a non-lymphoid cell population(s) regulates peripheral Treg levels and T1D development. (A-C) Tregs were analyzed in 7- to 10-week-old female NOD.Rag1−/− mice adoptively transferred with 2 × 10⁶ splenocytes from NOD or Cd70−/− donors. (A) Frequency of Foxp3+ cells among CD4+ T cells in NOD or Cd70−/− donor splenocytes before adoptive transfer. (B) Frequency of Foxp3+ cells among peripheral blood CD4+ T cells of recipient mice at the indicated time points. Results are displayed as mean ± SEM for 10 and 11 recipients of NOD and Cd70−/− splenocytes, respectively. (C) Frequency of Foxp3+ cells among splenic CD4+ T cells of recipient mice 3 weeks after adoptive transfer. (D) The proportion Foxp3+ CD4+ T cells in the spleen, pLN, and pancreatic islet infiltrates of NOD.Rag1−/− and NOD. Rag1−/−.Cd70−/− mice 7 to 10 weeks post-adoptive transfer with 5 × 10⁶ NOD T cells. (E) Percentage of Helios+ and Helios− Tregs among splenic CD4+ T cells of NOD.Rag1−/− and NOD. Rag1−/−.Cd70−/− recipient mice. (F) Frequency and (G) number of CD4+ and CD8+ T cells among splenocytes of NOD.Rag1−/− and NOD. Rag1−/−.Cd70−/− recipient mice. (H) Incidence of T1D in NOD.Rag1−/− and NOD.Rag1−/−.Cd70−/− mice injected with 5 × 10⁶ T cells isolated from 6- to 8-wk old female NOD mice. (I) T1D incidence of NOD.Rag1−/− and NOD.Rag1−/−.Cd70−/− mice injected with 5 × 10⁶ T cells isolated from 6- to 8-wk old NOD.FOXP3-GFP-Cre.Rosa26-YFP females after depletion of Foxp3+ cells and cells that had at some point expressed Foxp3. Recipients were analyzed for the development of T1D or until the mice developed ulcerative colitis. Results are displayed as mean ± SEM with each symbol representing a single mouse, unless otherwise indicated. Statistical differences were analyzed by the Mann-Whitney test. Survival curves were compared by Log-rank test. *P < 0.05, **P < 0.01, ***P < 0.001.
