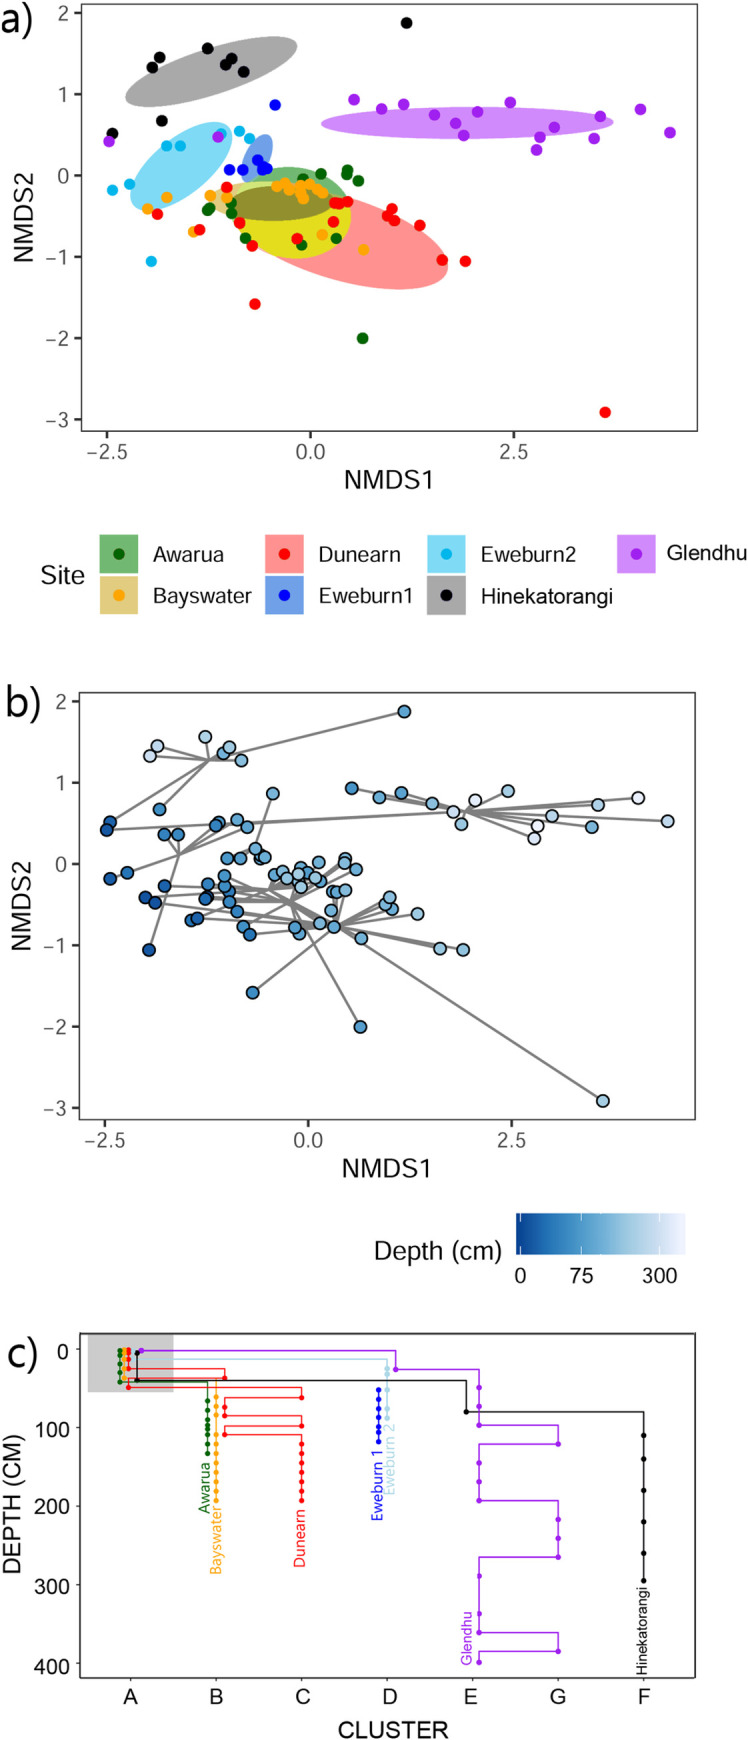
Fig 6. NMDS ordination of samples based on metabolic pathway composition.

Coloured by a) locality and b) depth. c) Clusters assigned using hierarchical cluster analysis (cut at k = 7) plotted against depth.

Coloured by a) locality and b) depth. c) Clusters assigned using hierarchical cluster analysis (cut at k = 7) plotted against depth.