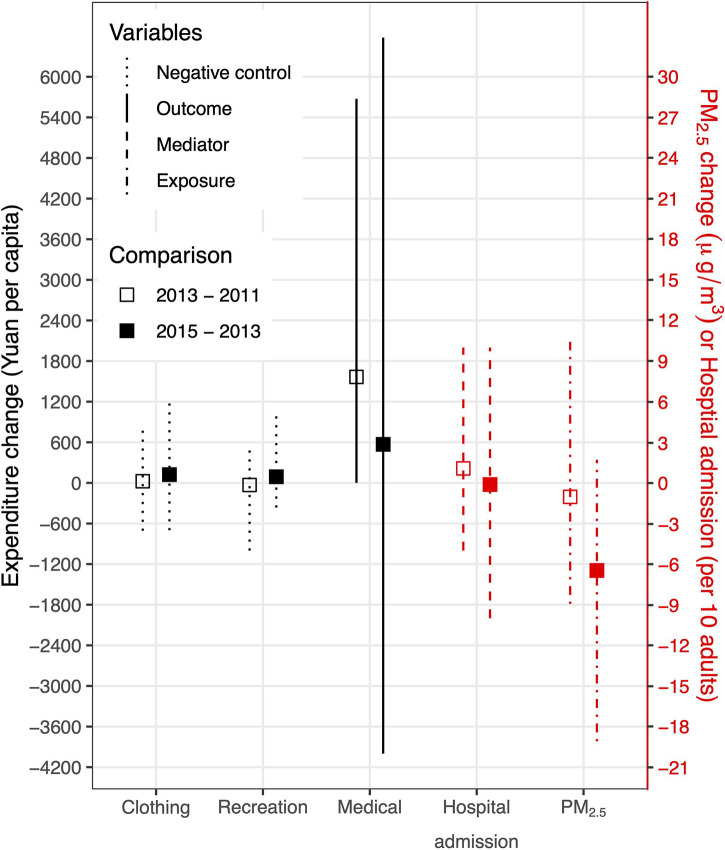
Fig 2. Comparisons of the annual expenditure change and corresponding PM2.5 change before (empty squares) and after (filled squares) the clean air actions in China.
The error bars present the 95% confidence intervals for the changes, and the line types present different roles of the variables played in this study. PM, particulate matter.

