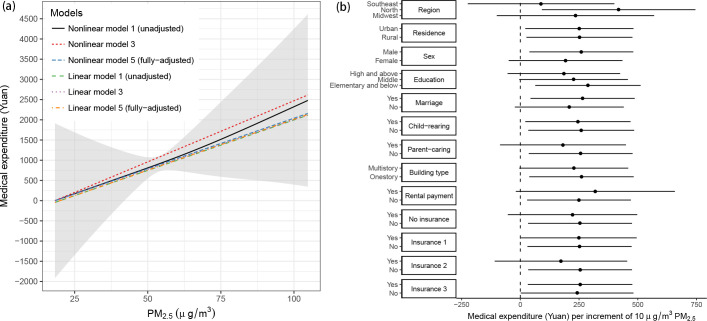
Fig 3.
Estimated exposure–response functions between PM2.5 and medical expenditures (per capita) for different models (left) and subpopulations (right). The left panel shows the associations estimated using linear or nonlinear models (penalized spline models) with adjustments for different sets of covariates. The right panel shows the associations estimated from the fully adjusted linear models by different subgroups. Insurance 1: urban employee basic medical insurance, Insurance 2: urban resident basic medical insurance, Insurance 3: rural new cooperative medical scheme. PM, particulate matter.

