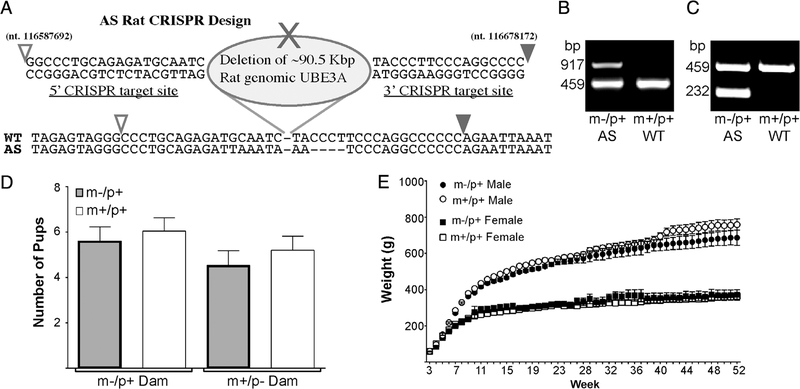
Figure 1.
(A) Schematic of the Ube3a gene deletion including target sites for the CRISPR guide RNA’s and actual sequence of the gene region below. Open arrowhead represents nucleotide sequence number 116587692 and the closed arrow represents nucleotide 116678172 of the rat chromosome 1 (NCBI Ref. Seq.: NC_005100.4). (B) Representative image of PCR results from primers used in initial genotype screening generates a ~900 bp band for the AS deletion. Samples positive for the full deletion alongside a WT control group are shown (WT primers generate a ~450 bp band). (C) Representative image of additional genotyping PCR with results for the AS full deletion (232 bp) alongside a WT control group. (D) Normal litter size and Mendelian distribution is seen regardless of whether the dam had a paternal or maternal deletion for Ube3a (Paternal deletion dam, n = 24; Maternal deletion dam n = 15). (E) Weights measured every week up to 1 year of age. When compared to WT (m+/p+) littermate controls n = 18 (10M, 8F), AS (m-/p+) rats n = 11 (6M, 5F) do not have a significant difference in weight-based upon sex.

