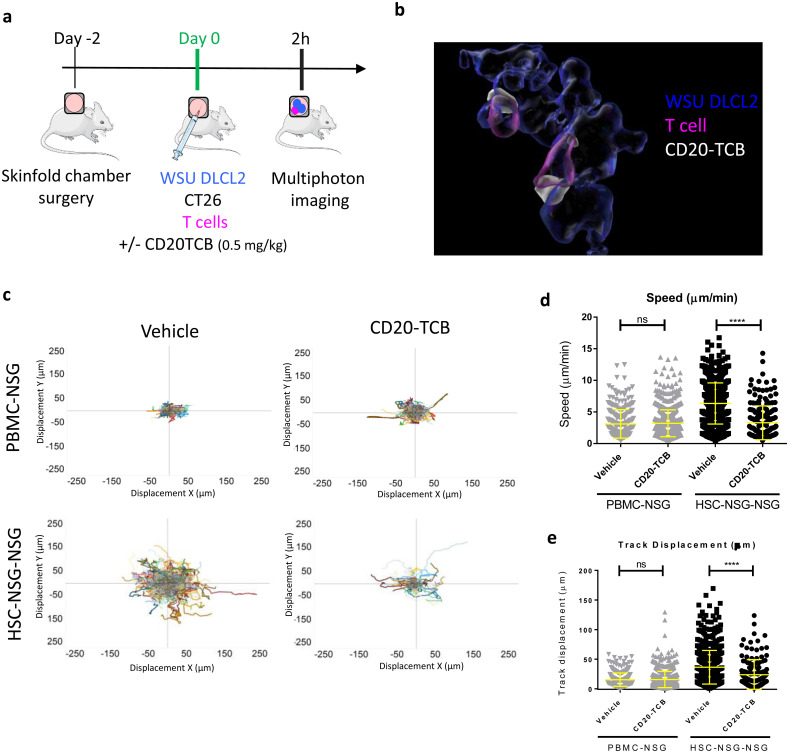
Fig 2. A xenoreaction-free model to quantify T cell dynamics in response to therapy.
a) Workflow schematics: skinfold chambers were installed on NSG mice (day -2). 48 hours later (day 0): WSU DLCL2 (blue), unstained CT26 cells, and CD2+ T cells (pink) freshly purified from human PBMCs or from HSC-NSG mice were injected intra-dermally in the skinfold chamber together with labeled CD20-TCB (0.5 mg/kg) or with suitable vehicle. Cells were imaged 2 hours post treatment by MP-IVM. Adapted from https://smart.servier.com/. b) 3D representative rendering of MP-IVM imaging on skinfold chamber of HSC-NSG-NSG mice showing localization of therapy (white) at the contact site between WSU DLCL2 cells (blue) and T cells (pink), 2 hours post treatment. c) MP-IVM analysis of T cells tracks in the skin fold chamber of PBMC-NSG (top) vs HSC-NSG-NSG mice (bottom), +/- CD20-TCB. T cell tracks are plotted according to their displacement in the X and Y axes. Total number of tracks for each plot is: Top left: Vehicle n = 330. Top right: CD20-TCB n = 759. Bottom left: Vehicle n = 741. Bottom right: CD20-TCB n = 185. d-e) Quantification of (d) Track Speed (μm/min) and (e) Track displacement (μm) of T cells in PBMC-NSG or HSC-NSG-NSG mice, +/- CD20-TCB. Shown in yellow are mean values +/- s.d. Unpaired t-test; ****p<0.0001; n.s.: not significant.

