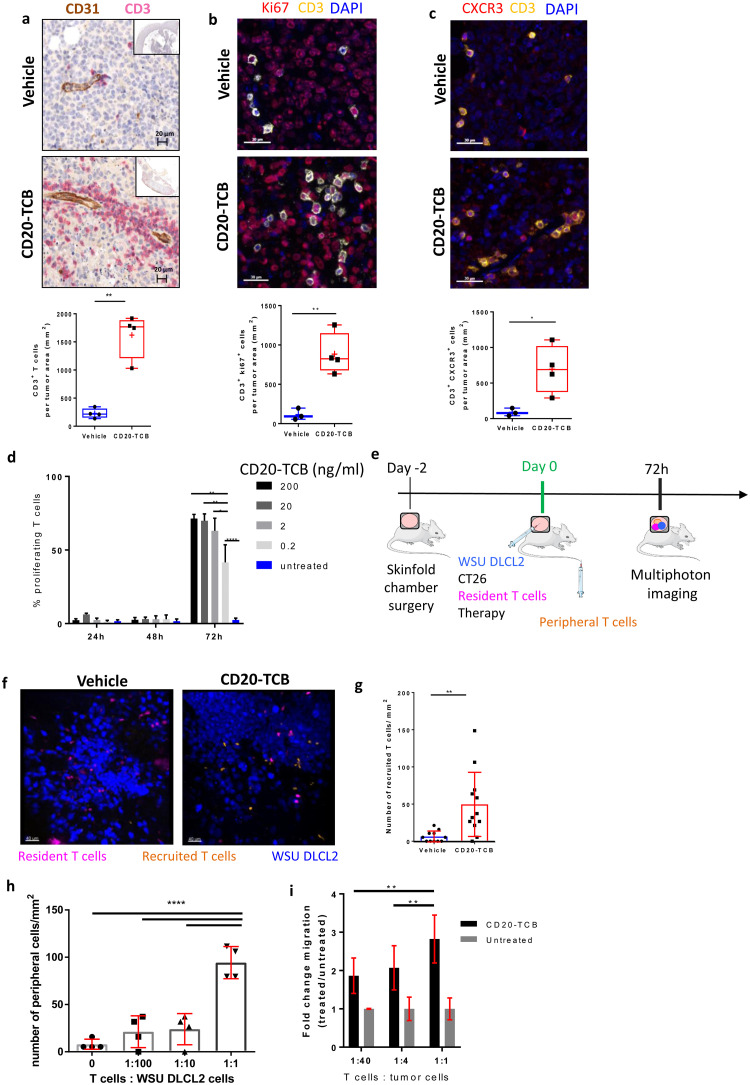
Fig 4. CD20-TCB induces resident T cell proliferation and recruitment of peripheral blood T cells.
a-c) Top: Representative histological staining of WSU DLCL2 tumors 24h post second treatment (0.5 mg/kg CD20-TCB or suitable vehicle i.v.). Bottom: Quantification of total number of cells/mm2 from histological images of vehicle vs CD20-TCB treatment. Whole slide scans quantification of 4 μm FFPE sections with the software (a) Definiens; (b-c) Halo. Statistical analysis: Unpaired 2-tailed t-test with Welch’s correction. *p<0.05, **p<0.005 (a) Red: CD3 staining, brown: CD31 staining. Quantification: Number of CD3+ cells b) red: Ki67, yellow: CD3, blue: DAPI. Quantification: Number of CD3+ Ki67+ cells c) Red: CXCR3, yellow: CD3, Blue: DAPI. Quantification of CD3+ CXCR3+ T cells. d) Percentage of proliferating CD8+ T cells, as assessed by CFSE dilution, freshly purified from PBMCs. Proliferation has been evaluated at 24h, 48h and 72h post CD20-TCB treatment, at the indicated doses, in the presence of WSU DLCL2 cells as target. n = 3 per group, mean and s.d. are shown. One-way Anova, *p<0.05, **p<0.005, ****p<0.0001. e) Workflow schematics: Skinfold chamber were installed on NSG mice. 48h later, WSU DLCL2 (Blue), unstained CT26 cells, and CD2+ T cells freshly purified from HSC-NSG spleens (pink) were injected intra-dermally in the skinfold chamber, together with 0.25 mg/kg of CD20-TCB or with suitable vehicle. Concomitantly, freshly purified CD2+ T cells from HSC-NSG spleens (orange) were injected i.v. to allow visualization of peripheral blood T cells. Cells were imaged 72h post treatment by MP-IVM. f) Representative MP-IVM imaging of the tumors. Blue: WSU DLCL2 cells; Pink: Resident T cells; Orange: Recruited T cells. Images were acquired 72h post intradermal treatment with 0.25 mg/kg CD20-TCB or suitable vehicle. Adapted from https://smart.servier.com/ g) Quantification of peripheral T cells (number/mm2) 72h post treatment. Mean +/- s.d. are shown. Unpaired 2-tailed t-test with Welch’s correction. **p<0.005. h) In the context of the skinfold chamber model, increasing number of T cells (Resident) were co-injected with the tumor and 0.25 mg/kg of CD20-TCB intradermally, while 2.5*106 T cells were injected intravenously (Peripheral). 72h post treatment, peripheral blood T cells were counted for each tumor from 5 representative fields. 4 tumors per group were analyzed. Shown is the count of peripheral T cells/mm2, Mean +/- s.d. per group. Statistical analysis: One-way Anova. **** p<0.0001. i) 3 hours in vitro chemotaxis assay of T cells toward preconditioned medium derived from WSU DLCL2 co-culture with CD3/CD28 pre-activated T cells. Pre-activated CD8 T cells have been plated with WSU DLCL2 cells at decreasing T cells: Tumor cells ratios, in the presence of 200 ng/ml of CD20-TCB. 24h later the supernatant has been collected and transferred to the bottom chamber of a 24-Transwell plate. In the top chamber 100.000 pre activated T cells, labeled with CFSE, have been seeded and let to migrate for 3 hours. Migration has been evaluated by counting total amount of CFSE positive migrated cells in the bottom chamber, by flow cytometry at constant volume and acquisition speed. Mean fold change and +/- s.d. are shown. n = 5, from two independent experiments 2-way Anova; **p<0.005.

