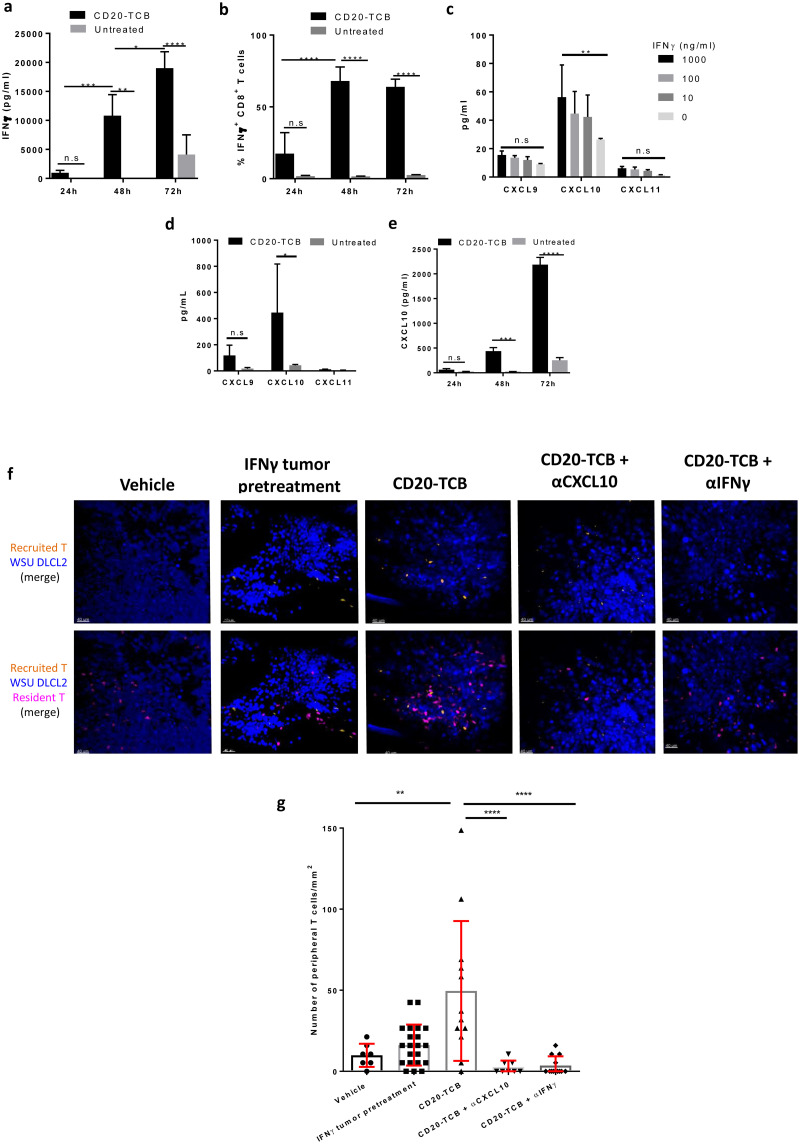
Fig 5. CD20-TCB-induced T cell recruitment is dependent on IFNγ and CXCL10.
a) IFNγ protein quantification by multiplex analysis of supernatant derived from co-culture of WSU DLCL2 cells with CD8+ T cells freshly purified from PBMCs and stimulated with CD20-TCB (200 ng/ml) at the indicated time points. n = 3 per group. Two-way Anova. *p< 0.05, **p< 0.05, ***p < 0.001, ****p < 0.0001, n.s.: not significant. b) Flow cytometry analysis of CD8+ INFγ+ T cells, at 24, 48 and 72 hours post in vitro CD20-TCB (200 ng/ml) treatment. c) Quantification of released cytokines (pg/mL) upon IFNγ stimulation of WSU DLCL2 tumor cells for 48 hours. Shown is Mean +/- s.d. of 3 replicates. d) Quantification of released cytokines (pg/mL) upon CD20-TCB treatment (200 ng/ml) of WSU DLCL2 co-cultured with CD3/CD28 pre-activated CD8+ T cells. Shown is Mean +/- s.d. n = 4 per group. Two-way Anova *p< 0.05, n.s.: not significant. e) CXCL10 protein quantification by multiplex analysis of supernant derived from co-culture of WSU DLCL2 cells with CD8+ T cells freshly purified from PBMCs and stimulated with CD20-TCB (200 ng/ml) at the indicated time points. n = 3 per group. Two-way Anova. ***p < 0.001, ****p < 0.0001, n.s. not significant. f) Representative images from MP-IVM imaging in the skinfold chamber of HSC-NSG-NSG mice. WSU DLCL2 cells (blue) pre-treated or not with IFNγ were injected intra-dermally together with CD2+ T cells derived from the spleen of HSC-NSG (pink) and 0.25 mg/kg CD20-TCB or suitable vehicle. CD2+ T cells derived from the spleen of HSC-NSG (orange) where concomitantly injected intravenously. Top row: Tumor cells (blue) and peripheral T cells (orange). Bottom row: Tumor cells (blue), resident T cells (pink) and peripheral T cells (orange). Where indicated, antibodies against CXCL10 or IFNγ were injected intravenously. g) Quantification of peripheral blood T cells (count/mm2) 72 hours post treatment. Shown are individual counts/mm2 and mean +/- s.d. Statistical analysis: One-way Anova. ***p < 0.001, ****p < 0.0001.

